Alcoa 2011 Annual Report Download - page 4
Download and view the complete annual report
Please find page 4 of the 2011 Alcoa annual report below. You can navigate through the pages in the report by either clicking on the pages listed below, or by using the keyword search tool below to find specific information within the annual report.-
 1
1 -
 2
2 -
 3
3 -
 4
4 -
 5
5 -
 6
6 -
 7
7 -
 8
8 -
 9
9 -
 10
10 -
 11
11 -
 12
12 -
 13
13 -
 14
14 -
 15
15 -
16
-
17
-
18
-
19
-
20
-
21
-
22
-
23
-
24
-
25
-
26
-
27
-
28
-
29
-
30
-
31
-
32
-
33
-
34
-
35
-
36
-
37
-
38
-
39
-
40
-
41
-
42
-
43
-
44
-
45
-
46
-
47
-
48
-
49
-
50
-
51
-
52
-
53
-
54
-
55
-
56
-
57
-
58
-
59
-
60
-
61
-
62
-
63
-
64
-
65
-
66
-
67
-
68
-
69
-
70
-
71
-
72
-
73
-
74
-
75
-
76
-
77
-
78
-
79
-
80
-
81
-
82
-
83
-
84
-
85
-
86
-
87
-
88
-
89
-
90
-
91
-
92
-
93
-
94
-
95
-
96
-
97
-
98
-
99
-
100
-
101
-
102
-
103
-
104
-
105
-
106
-
107
-
108
-
109
-
110
-
111
-
112
-
113
-
114
-
115
-
116
-
117
-
118
-
119
-
120
-
121
-
122
-
123
-
124
-
125
-
126
-
127
-
128
-
129
-
130
-
131
-
132
-
133
-
134
-
135
-
136
-
137
-
138
-
139
-
140
-
141
-
142
-
143
-
144
-
145
-
146
-
147
-
148
-
149
-
150
-
151
-
152
-
153
-
154
-
155
-
156
-
157
-
158
-
159
-
160
-
161
-
162
-
163
-
164
-
165
-
166
-
167
-
168
-
169
-
170
-
171
-
172
-
173
-
174
-
175
-
176
-
177
-
178
-
179
-
180
-
181
-
182
-
183
-
184
-
185
-
186
-
187
-
188
 |
 |

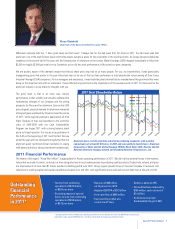
Every one of our four business segments delivered for Alcoa. Flat-Rolled Products and Engineered
Products and Solutions each achieved historic highs in profi tability and drove strong organic growth
in 2011. In our upstream operations, the Alumina business continued to return to historic high profi t
levels, and our Primary Metals business, where the LME price drop and rise in raw materials cost
had the greatest impact, fi nished the year about 20 percent below the 10-year average profi tability.
For each of our three operating groups, 2011 also created a strong base to meet our longer term
growth goals.
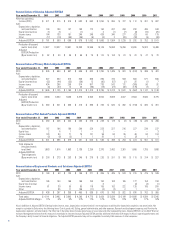
Global Primary Products (GPP): In our upstream business, we have been driving operational
effi ciencies and aggressively managing energy costs to drive our smelters and refi neries down
the cost curve and improve our cash fl ow. For example, in 2011, GPP reduced “Days Working
Capital” (DWC) by four days and reduced its total working capital by $130 million, or 12 percent.
Our long-term objective is to improve our refi nery position from the 30th percentile in 2010 to
the 23rd percentile in 2015, and our smelter position from the 51st percentile in 2010 to the 41st
percentile in 2015. Given the long-term nature of this business, these 2015 targets cannot be
reached overnight; restructuring and investment programs are in place to achieve them.
Flat-Rolled Products (FRP): In our midstream business, we achieved $1.4 billion in organic
growth in 2011, which is 55 percent of our $2.5 billion 2013 incremental revenue growth target. A
seven percent increase in volume, along with shifts in the Group’s portfolio towards higher margin
products, drove FRP’s historic profi t performance and record adjusted EBITDA/MT. Growth projects
in Russia, China, and Davenport, Iowa, are capturing global opportunities that will contribute to our
top-line growth while achieving higher profi tability.
Engineered Products and Solutions (EPS): Our downstream business achieved 44 percent of
its 2013 revenue increase target of $1.6 billion, with approximately $700 million in organic growth
in the fi rst year. Every downstream business unit – Fasteners, Forgings, Power and Propulsion,
Wheels, and Building and Construction – contributed to that success by driving revenue growth
through new product introductions and share gains. EPS also acquired the aerospace fastener
manufacturer TransDigm, which contributed $58 million in revenue in 2011.
2
Balance Sheet Shows Strong Liquidity and Financial Positions
Improved Free Cash Flow Generation
($ Millions) ($ Millions)($ Millions)
2008 2009 2010 2011
Significant Cash on Hand
Disciplined Capital Spending
Sustaining Capital Growth Capital
$1.2b Less Debt and 8% pts. Lower Debt-to-Cap
Gross Debt ($ Millions) Debt-to-Cap (%)
(2,204)
(257)
1,246 906
($ Millions)
2008 2009 2010 2011 2008 2009 2010 2011
762
1,481 1,543
1,939 10,578
1,431
516 570
924
2,007
1,106
445 363
9,819
9,165
9,371
43%
39%
35% 35%
2008 2009 2010 2011 2008 2009 2010 2011
Alumina: Remains Strong
Adjusted EBITDA/MT – LME
10 Yr. Average ~ $66/MT
2001
62
1,447 1,350 1,433
1,719
1,900
2,570 2,641 2,572
1,664
2,173 2,398
44 48 68 75
110 104 81
20
47 70
2002 2003 2004 2005 2006 2007 2008 2009 2010 2011
Primary Metals: Margin Compression
Adjusted EBITDA/MT – LME
10 Yr. Average ~ $390/MT
460
1,447 1,350 1,433
1,719
1,900
2,570 2,641 2,572
1,664
2,173 2,398
321 336 418 398
784 626
392
(159)
320 301
2001 2002 2003 2004 2005 2006 2007 2008 2009 2010 2011
Flat-Rolled Products: Continued Strength
Adjusted EBITDA/MT
10 Yr. Average ~ $231/MT
2001
290 273 253 249 276 201226
108 119
314 327
2002 2003 2004 2005 2006 2007 2008 2009 2010 2011
Eng. Products & Solutions: Improved Margins
Adjusted EBITDA Margin
2001
11%
8% 9%
12% 11% 13%
12%
15%
13%
17% 18%
2002 2003 2004 2005 2006 2007 2008 2009 2010 2011