Alcoa 2011 Annual Report Download - page 10
Download and view the complete annual report
Please find page 10 of the 2011 Alcoa annual report below. You can navigate through the pages in the report by either clicking on the pages listed below, or by using the keyword search tool below to find specific information within the annual report.-
 1
1 -
 2
2 -
 3
3 -
 4
4 -
 5
5 -
 6
6 -
 7
7 -
 8
8 -
 9
9 -
 10
10 -
 11
11 -
 12
12 -
 13
13 -
 14
14 -
 15
15 -
 16
16 -
 17
17 -
 18
18 -
 19
19 -
 20
20 -
 21
21 -
22
-
23
-
24
-
25
-
26
-
27
-
28
-
29
-
30
-
31
-
32
-
33
-
34
-
35
-
36
-
37
-
38
-
39
-
40
-
41
-
42
-
43
-
44
-
45
-
46
-
47
-
48
-
49
-
50
-
51
-
52
-
53
-
54
-
55
-
56
-
57
-
58
-
59
-
60
-
61
-
62
-
63
-
64
-
65
-
66
-
67
-
68
-
69
-
70
-
71
-
72
-
73
-
74
-
75
-
76
-
77
-
78
-
79
-
80
-
81
-
82
-
83
-
84
-
85
-
86
-
87
-
88
-
89
-
90
-
91
-
92
-
93
-
94
-
95
-
96
-
97
-
98
-
99
-
100
-
101
-
102
-
103
-
104
-
105
-
106
-
107
-
108
-
109
-
110
-
111
-
112
-
113
-
114
-
115
-
116
-
117
-
118
-
119
-
120
-
121
-
122
-
123
-
124
-
125
-
126
-
127
-
128
-
129
-
130
-
131
-
132
-
133
-
134
-
135
-
136
-
137
-
138
-
139
-
140
-
141
-
142
-
143
-
144
-
145
-
146
-
147
-
148
-
149
-
150
-
151
-
152
-
153
-
154
-
155
-
156
-
157
-
158
-
159
-
160
-
161
-
162
-
163
-
164
-
165
-
166
-
167
-
168
-
169
-
170
-
171
-
172
-
173
-
174
-
175
-
176
-
177
-
178
-
179
-
180
-
181
-
182
-
183
-
184
-
185
-
186
-
187
-
188
 |
 |

8
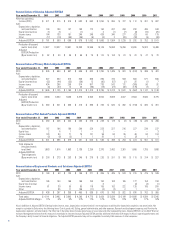
Reconciliation of Alumina Adjusted EBITDA
Year ended December 31, 2001 2002 2003 2004 2005 2006 2007 2008 2009 2010 2011
After-tax operating
income (ATOI) $ 471) $ 315) $ 415) $ 632) $ 682) $ 1,050) $ 956) $ 727) $ 112) $ 301) $ 607)
Add:
Depreciation, depletion,
and amortization 144) 139) 147) 153) 172) 192) 267) 268) 292) 406) 444)
Equity (income) loss (1) (1) –) (1) –) 2) (1) (7) (8) (10) (25)
Income taxes 184) 130) 161) 240) 246) 428) 340) 277) (22) 60) 179)
Other (17) (14) (55) (46) (8) (6) 2) (26) (92) (5) (44)
Adjusted EBITDA $ 781) $ 569) $ 668) $ 978) $ 1,092) $ 1,666) $ 1,564) $ 1,239) $ 282) $ 752) $ 1,161)
Production (thousand
metric tons) (kmt) 12,527) 13,027) 13,841) 14,343) 14,598) 15,128) 15,084) 15,256) 14,265) 15,922) 16,486)
Adjusted
EBITDA/Production
($ per metric ton) $ 62) $ 44) $ 48) $ 68) $ 75) $ 110) $ 104) $ 81) $ 20) $ 47) $ 70)
Reconciliation of Primary Metals Adjusted EBITDA
Year ended December 31, 2001 2002 2003 2004 2005 2006 2007 2008 2009 2010 2011
ATOI $ 905) $ 650) $ 657) $ 808) $ 822) $ 1,760) $ 1,445) $ 931) $ (612) $ 488) $ 481)
Add:
Depreciation, depletion,
and amortization 327) 300) 310) 326) 368) 395) 410) 503) 560) 571) 556)
Equity (income) loss (52) (44) (55) (58) 12) (82) (57) (2) 26) (1) 7)
Income taxes 434) 266) 256) 314) 307) 726) 542) 172) (365) 96) 92)
Other (8) (47) 12) 20) (96) (13) (27) (32) (176) (7) 2)
Adjusted EBITDA $ 1,606) $ 1,125) $ 1,180) $ 1,410) $ 1,413) $ 2,786) $ 2,313) $ 1,572) $ (567) $ 1,147) $ 1,138)
Production (thousand
metric tons) (kmt) 3,488) 3,500) 3,508) 3,376) 3,554) 3,552) 3,693) 4,007) 3,564) 3,586) 3,775)
Adjusted
EBITDA/Production
($ per metric ton) $ 460) $ 321) $ 336) $ 418) $ 398) $ 784) $ 626) $ 392) $ (159) $ 320) $ 301)
Reconciliation of Flat-Rolled Products Adjusted EBITDA
Year ended December 31, 2001 2002 2003 2004 2005 2006 2007 2008 2009 2010 2011
ATOI $ 253) $ 225) $ 222) $ 254) $ 278) $ 233) $ 178) $ (3) $ (49) $ 220) $ 266)
Add:
Depreciation, depletion,
and amortization 167) 184) 190) 200) 220) 223) 227) 216) 227) 238) 237)
Equity loss 2) 4) 1) 1) –) 2) –) –) –) –) 3)
Income taxes 124) 90) 71) 75) 121) 58) 92) 35) 48) 92) 104)
Other (5) (8) (5) 1) 1) 20) 1) 6) (2) 1) 1)
Adjusted EBITDA $ 541) $ 495) $ 479) $ 531) $ 620) $ 536) $ 498) $ 254) $ 224) $ 551) $ 611)
Total shipments
(thousand metric
tons) (kmt) 1,863) 1,814) 1,893) 2,136) 2,250) 2,376) 2,482) 2,361) 1,888) 1,755) 1,866)
Adjusted EBITDA/
Total shipments
($ per metric ton) $ 290) $ 273) $ 253) $ 249) $ 276) $ 226) $ 201) $ 108) $ 119) $ 314) $ 327)
Reconciliation of Engineered Products and Solutions Adjusted EBITDA
Year ended December 31, 2001 2002 2003 2004 2005 2006 2007 2008 2009 2010 2011
ATOI $ 189) $ 63) $ 124) $ 156) $ 271) $ 365) $ 435) $ 533) $ 315) $ 415) $ 539)
Add:
Depreciation, depletion,
and amortization 186) 150) 166) 168) 160) 152) 163) 165) 177) 154) 158)
Equity loss (income) –) –) –) –) –) 6) –) –) (2) (2) (1)
Income taxes 61) 39) 55) 65) 116) 155) 192) 222) 139) 195) 260)
Other –) 35) 11) 106) (11) (2) (7) 2) 1) –) (1)
Adjusted EBITDA $ 436) $ 287) $ 356) $ 495) $ 536) $ 676) $ 783) $ 922) $ 630) $ 762) $ 955)
Total sales $ 4,141) $ 3,492) $ 3,905) $ 4,283) $ 4,773) $ 5,428) $ 5,834) $ 6,199) $ 4,689) $ 4,584) $ 5,345)
Adjusted EBITDA Margin 11% 8% 9% 12% 11% 12% 13% 15% 13% 17% 18%
Alcoa’s defi nition of Adjusted EBITDA (Earnings before interest, taxes, depreciation, and amortization) is net margin plus an add-back for depreciation, depletion, and amortization. Net
margin is equivalent to Sales minus the following items: Cost of goods sold; Selling, general administrative, and other expenses; Research and development expenses; and Provision for
depreciation, depletion, and amortization. The Other line in the tables above includes gains/losses on asset sales and other nonoperating items. Adjusted EBITDA is a non-GAAP fi nancial
measure. Management believes that this measure is meaningful to investors because Adjusted EBITDA provides additional information with respect to Alcoa’s operating performance and
the Company’s ability to meet its fi nancial obligations. The Adjusted EBITDA presented may not be comparable to similarly titled measures of other companies.