Airtran 2004 Annual Report Download - page 33
Download and view the complete annual report
Please find page 33 of the 2004 Airtran annual report below. You can navigate through the pages in the report by either clicking on the pages listed below, or by using the keyword search tool below to find specific information within the annual report.-
 1
1 -
2
-
3
-
4
-
5
-
6
-
7
-
8
-
9
-
10
-
11
-
12
-
13
-
14
-
15
-
16
-
17
-
18
-
19
-
20
-
21
-
22
-
 23
23 -
 24
24 -
 25
25 -
 26
26 -
 27
27 -
 28
28 -
 29
29 -
 30
30 -
 31
31 -
 32
32 -
 33
33 -
 34
34 -
 35
35 -
 36
36 -
 37
37 -
 38
38 -
 39
39 -
 40
40 -
 41
41 -
 42
42 -
 43
43 -
44
 |
 |

33
2004 Annual Report
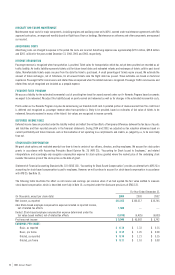
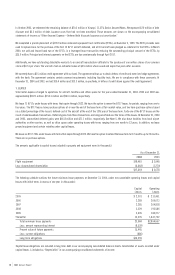
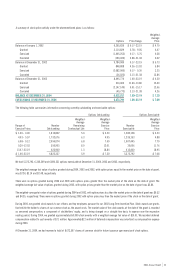
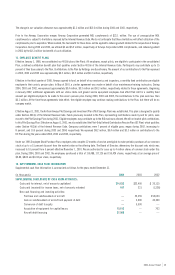
A summary of stock option activity under the aforementioned plans is as follows:
Weighted-
Average
Options Price Range Price
Balance at January 1, 2002 9,265,839 $ 0.17–23.19 $ 4.79
Granted 2,114,829 2.78– 9.05 6.47
Exercised (1,405,253) 0.17– 5.75 0.58
Canceled (190,426) 3.88–21.38 6.02
Balance at December 31, 2002 9,784,989 0.17–23.19 $ 5.73
Granted 848,808 4.36–13.03 5.84
Exercised (2,082,000) 0.17– 9.30 3.25
Canceled (56,023) 5.13–21.38 13.86
Balance at December 31, 2003 8,495,774 1.00–23.19 $ 6.20
Granted 514,405 11.40–13.80 12.40
Exercised (2,147,149) 0.01–15.17 12.66
Canceled (40,773) 3.13–21.38 4.26
BALANCE AT DECEMBER 31, 2004 6,822,257 1.00–23.19 $ 7.20
EXERCISABLE AT DECEMBER 31, 2004 5,373,792 1.00–23.19 $ 7.08
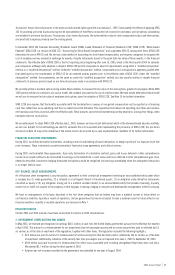
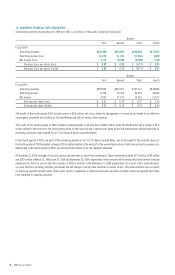
The following table summarizes information concerning currently outstanding and exercisable options:
Options Outstanding Options Exercisable
Weighted- Weighted- Weighted-
Average Average Average
Range of Number Remaining Exercise Number Exercise
Exercise Prices Outstanding Contractual Life Price Exercisable Price
$ 1.00– 4.00 1,816,802 5.0 $ 3.30 1,582,128 $ 3.23
4.03– 5.97 1,732,676 6.3 4.95 1,235,153 4.88
6.08– 9.12 2,096,074 6.8 7.69 1,907,445 7.79
9.30–13.03 550,905 8.9 12.01 36,666 11.76
13.67–23.19 625,900 1.3 18.84 612,400 18.95
$ 1.00–23.19 6,822,357 5.9 $ 7.20 5,373,792 $ 7.08
We had 5,373,793, 6,366,369 and 6,890,331 options exercisable at December 31, 2004, 2003 and 2002, respectively.
The weighted-average fair value of options granted during 2004, 2003 and 2002, with option prices equal to the market price on the date of grant,
was $7.24, $3.14 and $2.48, respectively.
There were no options granted during 2004 and 2003 with options prices greater than the market price of the stock on the date of grant. The
weighted-average fair value of options granted during 2002, with option prices greater than the market price on the date of grant was $2.86.
The weighted-average fair value of options granted during 2004 and 2003, with option prices less than the market price on the date of grant was $9.52
and $4.35, respectively. There were no options granted during 2002 with option prices less than the market price of the stock on the date of grant.
During 2004, we granted stock awards to our officers and key employees pursuant to our 2002 Long-Term Incentive Plan. Stock awards are grants
that entitle the holder to shares of our common stock as the award vests. The market value of the stock awards at the date of the grant is recorded
as unearned compensation, a component of stockholders’ equity, and is being charged on a straight-line basis to expense over the respective
vesting period. During 2004, we granted approximately 650,000 stock awards with a weighted-average fair value of $10.91. We recorded deferred
compensation related to such awards of $7.1 million. Approximately $2.5 million of deferred compensation was amortized as compensation expense
during 2004.
At December 31, 2004, we had reserved a total of 8,673,567 shares of common stock for future issuance upon exercise of stock options.