Airtran 2002 Annual Report Download - page 25
Download and view the complete annual report
Please find page 25 of the 2002 Airtran annual report below. You can navigate through the pages in the report by either clicking on the pages listed below, or by using the keyword search tool below to find specific information within the annual report.-
 1
1 -
2
-
3
-
4
-
5
-
6
-
7
-
8
-
9
-
10
-
11
-
12
-
13
-
14
-
 15
15 -
 16
16 -
 17
17 -
 18
18 -
 19
19 -
 20
20 -
 21
21 -
 22
22 -
 23
23 -
 24
24 -
 25
25 -
 26
26 -
 27
27 -
 28
28 -
 29
29 -
 30
30 -
 31
31 -
 32
32 -
 33
33 -
 34
34 -
 35
35 -
36
-
37
-
38
-
39
-
40
-
41
-
42
-
43
-
44
-
45
-
46
-
47
-
48
-
49
-
50
-
51
 |
 |

we expected to receive pursuant to the Stabilization Act. Our nonoperating results for 2001 included a special item of $4.3 million representing additional debt discount amortization
resulting from the exercise of conversion rights on approximately two-thirds of our 7. 75% Convertible Notes. Our diluted earnings per common share for the year ended December 31,
2001 were increased by $0.42 upon recognition of the government grant (see Note 3 to the Consolidated Financial Statements).
Our passenger revenues for the period from September through December 2001 were significantly affected by the September 11 Events. In response to the terrorist attacks, the Federal
Aviation Administration (FAA) immediately issued a federal ground stop order on September 11th, which prohibited all civil aviation flights from operation within the national airspace
of the United States. The U.S. airspace was not reopened until September 13th, at which time we operated a portion of our pre-September 11th scheduled operations. Once flights
resumed, passenger traffic and yields were significantly lower than we had experienced prior to September 11th. In an effort to match our capacity to the reduced level of demand, we
reduced our operations to levels similar to those we operated during the same period in 2000, despite the fact that we had been successful in growing our capacity by 18 percent earlier
in the year. In addition, many corporations curtailed their business travel and leisure travelers cancelled or postponed vacations, which forced airlines to reduce airfares in an attempt
to stimulate demand. Despite these actions, our traffic dropped in the post-September 11th period by over 11 percent, which resulted in our passenger load factor declining eight
percentage points compared to the previous year. Passenger yields also suffered during the post-September 11th period declining nearly 15 percent year-over-year. This resulted in
a $51.8 million, or 25 percent, decline in passenger revenues compared to the same time period in 2000.
On September 22, 2001, President Bush signed into law the Stabilization Act, which provided, in part, for qualifying U.S. airlines and air cargo carriers to receive: up to $5 billion in
compensation for direct losses, including lost revenues, incurred as a direct result of the FAA ground stop order and for incremental losses incurred through December 31, 2001 as
a direct result of the September 11 Events; up to $10 billion in federal government loan guarantees; reimbursement for certain insurance increases; and the extension in due dates for
payment of certain excise taxes. Each air carrier was entitled to receive the lesser of its direct and incremental losses for the period of September 11, 2001 to December 31, 2001 or its
available seat mile (ASM) allocation of the $5 billion compensation. We received compensation payments of $5.0 million and $24.6 million during 2002 and 2001, respectively. Related
to these payments, we recognized income of $0.6 million and $29.0 million in 2002 and 2001, respectively, which is included in Operating Expenses – Government Grant on the
accompanying Consolidated Statements of Operations.
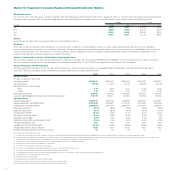
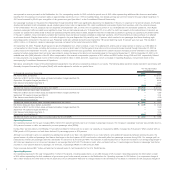
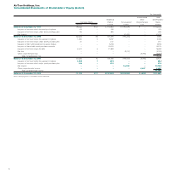
We believe excluding the impact of the aforementioned special items may enhance comparative analysis of our results. The following table reconciles results reported in accordance with
Generally Accepted Accounting Principles (GAAP) with results adjusted to exclude our special items:
For the year ended
December 31,
(In thousands, except per share data) 2002 2001
Net income (loss), as reported $10,745 $ (2,757)
Reduction of B737 and DC-9 fleet values and lease termination charges (see Note 13) –46,069
September 11th special charges (see Note 3) –2,494
Debt discount amortization (see Note 7) –4,291
Government grant (see Note 3) (640) (28,951)
Adjusted net income, excluding special items (non-GAAP) $10,105 $ 21,146
Net income (loss) per share, basic, as reported $ 0.15 $ (0.04)
Reduction of B737 and DC-9 fleet values and lease termination charges (see Note 13) –0.68
September 11th special charges (see Note 3) –0.04
Debt discount amortization (see Note 7) –0.06
Government grant (see Note 3) (0.01) (0.42)
Adjusted net income per share, basic, excluding special items (non-GAAP) $ 0.14 $ 0.32
Net income (loss) per share, diluted, as reported $ 0.15 $ (0.04)
Reduction of B737 and DC-9 fleet values and lease termination charges (see Note 13) –0.68
September 11th special charges (see Note 3) –0.04
Debt discount amortization (see Note 7) –0.06
Government grant (see Note 3) (0.01) (0.42)
Adjusted net income per share, diluted, excluding special items (non-GAAP) $ 0.14 $ 0.32
Operating Revenues
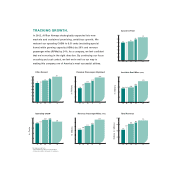
Our operating revenues for the year increased $68.2 million (10.3 percent) primarily due to an increase in passenger revenues. The increase in passenger revenues was primarily due to a
23.9 percent increase in traffic, as measured by revenue passenger miles (RPMs).
During 2002, we took delivery of 20 Boeing 717 aircraft and retired 14 DC9 aircraft. As a result, our capacity, as measured by ASMs, increased by 26.3 percent. When coupled with our
RPM growth of 23.9 percent, our load factor declined 1.3 percentage points to 67.6 percent.
Although we continued to grow our operations by adding new aircraft to our fleet, new destinations to our route network, and additional frequencies between existing city pairs, the
general erosion of yields and passenger load factors that began in the third quarter of 2001 continued to unfavorably affect our passenger revenues during 2002. Our average yield, as
measured by revenue per passenger seat mile, decreased 11.1 percent to 12.79 cents per RPM. The reduction in yield resulted from a 4.8 percent increase in our average stage length to
567 miles per departure and a 5.4 percent decrease in our average fare to $73.93. This decline in yield, when combined with our 1.3 percentage point decline in passenger load factor,
resulted in a 12.9 percent decline in passenger unit revenues, or passenger RASM, to 8.64 cents per ASM.
Cargo revenues declined $0.7 million primarily due to reduced levels of mail transported for the U.S. Postal Service.
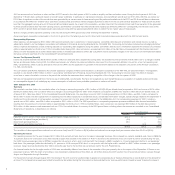
Operating Expenses
Our operating expenses for the year increased $72.7 million (11.6 percent), including special items, on an ASM increase of 26.3 percent. Operating expenses for 2002 reflect a credit
of $0.6 million representing the final installment of government grant funds received pursuant to the Stabilization Act. Operating expenses for 2001 reflect: (i) an impairment charge of
$18.1 million related to the write-down of the net book value of our owned B737 fleet and for charges related to the termination of the lease on one B737 aircraft; (ii) special charges of
4