Air New Zealand 2009 Annual Report Download - page 54
Download and view the complete annual report
Please find page 54 of the 2009 Air New Zealand annual report below. You can navigate through the pages in the report by either clicking on the pages listed below, or by using the keyword search tool below to find specific information within the annual report.-
 1
1 -
2
-
3
-
4
-
5
-
6
-
7
-
8
-
9
-
10
-
11
-
12
-
13
-
14
-
15
-
16
-
17
-
18
-
19
-
20
-
21
-
22
-
23
-
24
-
25
-
26
-
27
-
28
-
29
-
30
-
31
-
32
-
33
-
34
-
35
-
36
-
37
-
38
-
39
-
40
-
41
-
42
-
43
-
 44
44 -
 45
45 -
 46
46 -
 47
47 -
 48
48 -
 49
49 -
 50
50 -
 51
51 -
 52
52 -
 53
53 -
 54
54 -
 55
55 -
 56
56 -
 57
57 -
 58
58 -
 59
59 -
 60
60 -
 61
61 -
 62
62 -
 63
63 -
 64
64 -
65
-
66
-
67
-
68
-
69
-
70
-
71
-
72
-
73
-
74
-
75
-
76
 |
 |

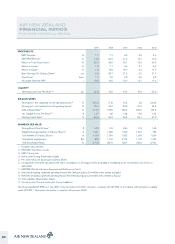
2009 2008 2007 2006 2005
PROFITABILITY
EBIT/Revenue 1 % 1.7 7.7 6.8 3.9 5.9
EBITDRA/Revenue1% 14.9 20.3 21.3 18.1 19.3
Return on Total Gross Assets 2 % 22.2 28.6 29.7 16.6 20.3
Return on Assets 3 % 1.5 7.1 6.2 3.1 5.2
Return on Equity 4 % 1.3 13.8 15.9 6.0 11.7
Basic Earnings Per Ordinary Share 6 cps 2.0 20.7 21.6 9.6 21.4
Fixed Cover 7 times 1.7 2.9 2.8 2.5 3.3
Passenger Revenue/RPK c 13.8 13.0 12.9 12.1 11.4
LIQUIDITY
Operating Cash Flow Per Share 5,6 cps 45.8 70.5 44.5 47.2 55.6
BALANCE SHEET
Gearing (excl. net capitalised aircraft operating leases) 8 % (25.3) (7.2) 15.5 5.8 (20.2)
Gearing (incl. net capitalised aircraft operating leases) 9 % 45.0 45.3 53.8 51.9 42.3
Debt to Equity Ratio 10 % 214.3 218.5 236.2 200.2 165.5
Net Tangible Assets Per Share 5,6 $ 1.47 1.45 1.28 1.59 1.54
Working Capital Ratio 11 % 56.4 55.3 52.3 52.1 57.2
SHAREHOLDER VALUE
Closing Share Price 30 June 6 $ 0.90 1.09 2.64 1.18 1.45
Weighted Average Number of Ordinary Shares 6 m 1,061 1,055 1,022 1,001 786
Total Number of Ordinary Shares 6 m 1,065 1,057 1,052 1,003 1,000
Total Market Capitalisation $m 959 1,152 2,776 1,183 1,450
Total Shareholder Return % (17.4) (58.7) 123.7 (18.6) (27.5)
1. Excludes Unusual Items
2. EBITDRA/Total Gross Assets
3. EBIT/Total Assets
4. Net Income/Closing Shareholders Equity
5. Per-share measures based upon Ordinary Shares
6. Comparatives have been adjusted for the share consolidation on 23 August 2004, by dividing or multiplying by the consolidation ratio of five as
appropriate.
7. EBITDRA/(Rental and Lease Expenses and Net Finance Costs).
8. Net Debt (excluding capitalised operating leases)/Net Debt plus Equity (Convertible notes treated as Equity)
9. Net Debt (including capitalised operating leases)/Net Debt plus Equity (Convertible notes treated as Equity)
10. Total Liabilities/Shareholders Equity
11. Current Assets/(Current Assets plus Current Liabilities)
The Group adopted NZ IFRS on 1 July 2007. Only information from 2007 onwards is compliant with NZ IFRS. In accordance with exemptions available
under NZ IFRS 1, all previous information is compliant with previous GAAP.
AIR NEW ZEALAND
FINANCIAL RATIOS
FIVE YEAR STATISTICAL REVIEW
52