Air New Zealand 2009 Annual Report Download - page 23
Download and view the complete annual report
Please find page 23 of the 2009 Air New Zealand annual report below. You can navigate through the pages in the report by either clicking on the pages listed below, or by using the keyword search tool below to find specific information within the annual report.-
 1
1 -
2
-
3
-
4
-
5
-
6
-
7
-
8
-
9
-
10
-
11
-
12
-
 13
13 -
 14
14 -
 15
15 -
 16
16 -
 17
17 -
 18
18 -
 19
19 -
 20
20 -
 21
21 -
 22
22 -
 23
23 -
 24
24 -
 25
25 -
 26
26 -
 27
27 -
 28
28 -
 29
29 -
 30
30 -
 31
31 -
 32
32 -
 33
33 -
34
-
35
-
36
-
37
-
38
-
39
-
40
-
41
-
42
-
43
-
44
-
45
-
46
-
47
-
48
-
49
-
50
-
51
-
52
-
53
-
54
-
55
-
56
-
57
-
58
-
59
-
60
-
61
-
62
-
63
-
64
-
65
-
66
-
67
-
68
-
69
-
70
-
71
-
72
-
73
-
74
-
75
-
76
 |
 |

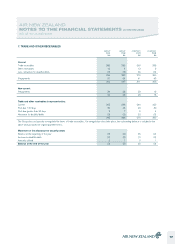
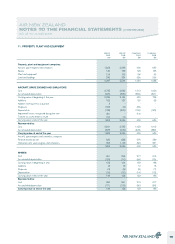
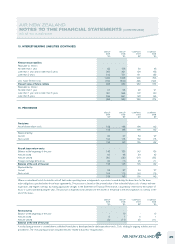
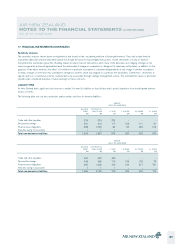
11. PROPERTY, PLANT AND EQUIPMENT (CONTINUED)
AIRCRAFT MARKET VALUES
The market values of aircraft tend to fluctuate from year to year. The directors have obtained independent valuations as at 30 June 2009 from The
Aircraft Value Analysis Company and Ascend Worldwide Limited to ascertain indicative market values of each aircraft on a stand alone basis. The average
of the valuations obtained is shown below:
INDICATIVE
VALUATION
USD
$M
INDICATIVE
VALUATION
NZD
$M
BOOK
VALUE*
NZD
$M
DIFFERENCE
NZD
$M
@ 0.6500
As at 30 June 2009 1,066 1,641 1,548 93
@ 0.7612
As at 30 June 2008 1,377 1,810 1,797 13
* Book Value excludes simulators, spare engines and operating leased aircraft improvements.
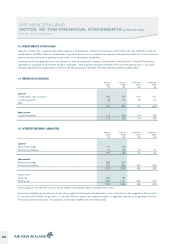
12. INTANGIBLE ASSETS
GROUP
2009
$M
GROUP
2008
$M
COMPANY
2009
$M
COMPANY
2008
$M
Intangible assets comprise:
Internally developed software 22 22 20 20
Externally purchased software 16 17 14 15
Goodwill 1 1 - -
39 40 34 35
INTERNALLY DEVELOPED SOFTWARE
Cost 110 100 107 97
Accumulated amortisation (88) (77) (87) (76)
Carrying value at beginning of the year 22 23 20 21
Additions 10 10 10 10
Amortisation (10) (11) (10) (11)
Carrying value at end of the year 22 22 20 20
Represented by:
Cost 117 110 113 107
Accumulated amortisation (95) (88) (93) (87)
Carrying value at end of the year 22 22 20 20
EXTERNALLY PURCHASED SOFTWARE
Cost 191 187 187 183
Accumulated amortisation (174) (163) (172) (162)
Carrying value at beginning of the year 17 24 15 21
Additions 7 4 7 4
Amortisation (8) (11) (8) (10)
Carrying value at end of the year 16 17 14 15
Represented by:
Cost 194 191 189 187
Accumulated amortisation (178) (174) (175) (172)
Carrying value at end of the year 16 17 14 15
At 30 June 2009 there is goodwill of $1 million (30 June 2008: $1 million). As at 30 June 2009, this was assessed for impairment using a value in use
model and no impairment provision is considered to be required. The discount rate applied in the value in use model as at 30 June 2009 was 10.0%.
AIR NEW ZEALAND
NOTES TO THE FINANCIAL STATEMENTS (CONTINUED)
AS AT 30 JUNE 2009
21