Air Canada 2008 Annual Report Download - page 21
Download and view the complete annual report
Please find page 21 of the 2008 Air Canada annual report below. You can navigate through the pages in the report by either clicking on the pages listed below, or by using the keyword search tool below to find specific information within the annual report.-
 1
1 -
2
-
3
-
4
-
5
-
6
-
7
-
8
-
9
-
10
-
 11
11 -
 12
12 -
 13
13 -
 14
14 -
 15
15 -
 16
16 -
 17
17 -
 18
18 -
 19
19 -
 20
20 -
 21
21 -
 22
22 -
 23
23 -
 24
24 -
 25
25 -
 26
26 -
 27
27 -
 28
28 -
 29
29 -
 30
30 -
 31
31 -
32
-
33
-
34
-
35
-
36
-
37
-
38
-
39
-
40
-
41
-
42
-
43
-
44
-
45
-
46
-
47
-
48
-
49
-
50
-
51
-
52
-
53
-
54
-
55
-
56
-
57
-
58
-
59
-
60
-
61
-
62
-
63
-
64
-
65
-
66
-
67
-
68
-
69
-
70
-
71
-
72
-
73
-
74
-
75
-
76
-
77
-
78
-
79
-
80
-
81
-
82
-
83
-
84
-
85
-
86
-
87
-
88
-
89
-
90
-
91
-
92
-
93
-
94
-
95
-
96
-
97
-
98
-
99
-
100
-
101
-
102
-
103
-
104
-
105
-
106
-
107
-
108
-
109
-
110
-
111
-
112
-
113
-
114
-
115
-
116
-
117
-
118
-
119
-
120
-
121
-
122
-
123
-
124
-
125
-
126
-
127
-
128
-
129
-
130
-
131
-
132
-
133
-
134
-
135
-
136
-
137
-
138
-
139
-
140
-
141
-
142
-
143
-
144
-
145
-
146
-
147
-
148
-
149
-
150
-
151
-
152
 |
 |

2008 Management’s Discussion and Analysis
21
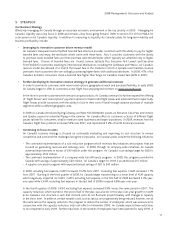
The following table compares Air Canada’s operating expenses per ASM for the fourth quarter of 2008 to Air Canada’s
operating expenses per ASM for the corresponding period in 2007.
(cents per ASM)
Fourth Quarter Change
2008 2007 cents %
Wages and salaries 2.71 2.56 0.15 5.9
Benefits 0.56 0.62 (0.06) (9.7)
Ownership (DAR) (1) 1.87 1.38 0.49 35.5
Airport user fees 1.70 1.61 0.09 5.6
Capacity purchase with Jazz 1.74 1.54 0.20 13.0
Aircraft maintenance 1.16 1.20 (0.04) (3.3)
Food, beverages and supplies 0.52 0.45 0.07 15.6
Communications and information technology 0.53 0.46 0.07 15.2
Commissions 0.29 0.25 0.04 16.0
Other 2.56 2.34 0.22 9.4
Operating expense, excluding fuel expense (2) 13.64 12.41 1.23 9.9
Aircraft fuel 5.84 4.18 1.66 39.7
Total operating expense 19.48 16.59 2.89 17.4
(1) DAR refers to the combination of Aircraft rent and Depreciation and amortization.
(2) Refer to section 20 “Non-GAAP Financial Measures” in this MD&A for additional information.
Fuel expense increased 29% from the fourth quarter of 2007
Fuel expense amounted to $792 million in the fourth quarter of 2008, an increase of $177 million or 29% from the fourth
quarter of 2007. Factors contributing to the year-over-year change in fourth quarter fuel expense included:
• Fuelhedginglossesof$111millioninthefourthquarterof2008versusfuelhedginggainsof$31millioninthe
fourth quarter of 2007, an unfavourable variance of $142 million compared to the fourth quarter of 2007.
• TheunfavourableimpactofaweakerCanadiandollarversustheUSdollarwhichaccountedforanincreaseof$110
million to fuel expense in the fourth quarter of 2008.
The above-noted increases were partially offset by the following:
• Avolume-relateddecreaseof$60million,includingterminationoffreighterying.
• Alowerbasefuelpricewhichaccountedforadecreaseof$15million.
Wages,salariesandbenetsexpenseamountedto$444millioninthefourthquarterof2008,adecreaseof$24
million or 5% from the fourth quarter of 2007
Wages and salaries expense totaled $369 million in the fourth quarter of 2008, a decrease of $8 million or 2% from the
fourth quarter of 2007. Factors contributing to the year-over-year change in fourth quarter wages and salaries expense
included:
• A year-over-year fourth quarter decrease of 1.3% or an average of 319 full-time equivalent (“FTE”) employees
on a capacity decrease of 7.8%. Given the required notice periods required under the Canada Labour Code, the
reductions in unionized ranks announced in June only took effect in November 2008. The insourcing of supply chain
management in the aircraft maintenance division accounted for an increase of approximately 200 FTE employees
compared to the same period in 2007.
• Provisionsrelatingtostock-basedcompensationexpenseamountedto$7millioninthefourthquarterof2007versus
nil in the fourth quarter of 2008. In the fourth quarter of 2008, provisions relating to stock-based compensation
were reversed as management had determined that certain performance vesting criteria would not be met.
• Provisionsrelatingtoemployeeprotsharingprogramsamountedto$11millioninthefourthquarterof2007
versus provisions of $3 million in the fourth quarter of 2008.