Air Canada 2008 Annual Report Download - page 12
Download and view the complete annual report
Please find page 12 of the 2008 Air Canada annual report below. You can navigate through the pages in the report by either clicking on the pages listed below, or by using the keyword search tool below to find specific information within the annual report.-
 1
1 -
 2
2 -
 3
3 -
 4
4 -
 5
5 -
 6
6 -
 7
7 -
 8
8 -
 9
9 -
 10
10 -
 11
11 -
 12
12 -
 13
13 -
 14
14 -
 15
15 -
 16
16 -
 17
17 -
 18
18 -
 19
19 -
 20
20 -
 21
21 -
 22
22 -
23
-
24
-
25
-
26
-
27
-
28
-
29
-
30
-
31
-
32
-
33
-
34
-
35
-
36
-
37
-
38
-
39
-
40
-
41
-
42
-
43
-
44
-
45
-
46
-
47
-
48
-
49
-
50
-
51
-
52
-
53
-
54
-
55
-
56
-
57
-
58
-
59
-
60
-
61
-
62
-
63
-
64
-
65
-
66
-
67
-
68
-
69
-
70
-
71
-
72
-
73
-
74
-
75
-
76
-
77
-
78
-
79
-
80
-
81
-
82
-
83
-
84
-
85
-
86
-
87
-
88
-
89
-
90
-
91
-
92
-
93
-
94
-
95
-
96
-
97
-
98
-
99
-
100
-
101
-
102
-
103
-
104
-
105
-
106
-
107
-
108
-
109
-
110
-
111
-
112
-
113
-
114
-
115
-
116
-
117
-
118
-
119
-
120
-
121
-
122
-
123
-
124
-
125
-
126
-
127
-
128
-
129
-
130
-
131
-
132
-
133
-
134
-
135
-
136
-
137
-
138
-
139
-
140
-
141
-
142
-
143
-
144
-
145
-
146
-
147
-
148
-
149
-
150
-
151
-
152
 |
 |
2008 Air Canada Annual Report
12
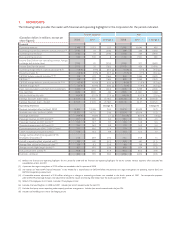
significantly weaker Canadian dollar versus the US dollar in the fourth quarter of 2008, a decrease of 5.4% in aircraft
utilization and a reduction of 2.8% in average stage length were also contributing factors in the year-over-year
increase in CASM, excluding fuel expense, in the fourth quarter of 2008.
• Continuingtofocusonsoundcapacitymanagement
As previously discussed, on June 17, 2008, in response to historically high fuel prices, Air Canada announced capacity
and staff reductions for the fall and winter schedule.
In the second half of 2008, Air Canada reduced its capacity by 5.4% compared to the second half of 2007. The traffic
decrease of 3.6% was less than the capacity reduction of 5.4%, resulting in a 1.6 percentage point improvement in
passenger load factor compared to the second half of 2007. By focusing diligently on network management and as
a result of capacity constraints in the airline industry in general, Air Canada was able to successfully shift its capacity
to better match passenger demand.
ASM capacity for the full year 2008 decreased 1.2% from the full year 2007. In 2008, the traffic decrease of 0.2%
was less than the capacity reduction of 1.2%, resulting in a 0.8 percentage point improvement in passenger load
factor compared to 2007.
Capacity constraints generally improve passenger load factors and lead to a more favourable fare mix, thus resulting
in increased yields. RASM growth is driven by a higher passenger load factor or a higher yield, or both.
With the slowing economy continuing to impact both its leisure and business customers, one of Air Canada’s
challenges in 2009 will be to maintain high passenger load factors through continued aggressive capacity management.
• Maintainingahighdegreeofwebpenetrationandincreasingdirectdistribution
Air Canada’s transparent pricing strategy and its user-friendly web platform have contributed to a high level of web
penetration which, in turn, has allowed it to reduce its distribution costs.
Air Canada maintains two websites, one for consumers and the other for travel agencies. Both websites offer the
same unique products. Customers continue to benefit from the ability to check into Air Canada flights departing
from any Canadian city and from most US and international cities to Canada up to 24 hours prior to departure
by using the web check-in facility provided on the Air Canada website. This has allowed Air Canada to generate
cost savings while increasing its customer satisfaction. Web penetration for domestic Canada sales in 2008 was
66%, an increase of 3 percentage points from 2007 (63% in 2007). Web penetration for combined Canada and US
transborder sales was 54%, an increase of 4 percentage points from 2007. In 2008, 74% of domestic Canada sales,
or 64% when combined with US sales, were made directly with Air Canada, either online or through call centres
(compared to 73% of domestic Canada sales, or 61% when combined with US sales, in 2007).
• Furtherenhancingitsproductofferingthrougharedesignednetworkandarenewedeet
Within North America, Air Canada adopted a demand-based network strategy through the use of large regional jet
aircraft which have lower trip costs than conventional narrow-body aircraft. Starting in 2005, Air Canada progressively
introduced 15 Embraer E175 and 45 Embraer E190 aircraft into its fleet. This has allowed Air Canada to offer its
customers improved frequencies on key routes, maintain competitive frequencies on other routes and introduce new
non-stop routes thus serving customers to destinations where such demand was expected.
In order to support the expansion of its international operations and deliver a superior aircraft product in the
international market to and from Canada, starting in 2007, Air Canada progressively introduced 16 Boeing 777
aircraft into its fleet. One of two additional Boeing 777 aircraft is expected to be delivered in the first quarter
of 2009, with the last Boeing 777 aircraft expected to be delivered in the third quarter of 2009. The new Boeing
777 aircraft is allowing Air Canada to modernize and re-size its fleet and reduce operating costs through fuel and
maintenance savings in addition to gaining greater manpower efficiency and economies of scale. This new aircraft
is also providing Air Canada with the ability to serve new markets that could not be previously served in an efficient
manner.