Air Canada 2008 Annual Report Download - page 2
Download and view the complete annual report
Please find page 2 of the 2008 Air Canada annual report below. You can navigate through the pages in the report by either clicking on the pages listed below, or by using the keyword search tool below to find specific information within the annual report.-
 1
1 -
 2
2 -
 3
3 -
 4
4 -
 5
5 -
 6
6 -
 7
7 -
 8
8 -
 9
9 -
 10
10 -
 11
11 -
 12
12 -
 13
13 -
14
-
15
-
16
-
17
-
18
-
19
-
20
-
21
-
22
-
23
-
24
-
25
-
26
-
27
-
28
-
29
-
30
-
31
-
32
-
33
-
34
-
35
-
36
-
37
-
38
-
39
-
40
-
41
-
42
-
43
-
44
-
45
-
46
-
47
-
48
-
49
-
50
-
51
-
52
-
53
-
54
-
55
-
56
-
57
-
58
-
59
-
60
-
61
-
62
-
63
-
64
-
65
-
66
-
67
-
68
-
69
-
70
-
71
-
72
-
73
-
74
-
75
-
76
-
77
-
78
-
79
-
80
-
81
-
82
-
83
-
84
-
85
-
86
-
87
-
88
-
89
-
90
-
91
-
92
-
93
-
94
-
95
-
96
-
97
-
98
-
99
-
100
-
101
-
102
-
103
-
104
-
105
-
106
-
107
-
108
-
109
-
110
-
111
-
112
-
113
-
114
-
115
-
116
-
117
-
118
-
119
-
120
-
121
-
122
-
123
-
124
-
125
-
126
-
127
-
128
-
129
-
130
-
131
-
132
-
133
-
134
-
135
-
136
-
137
-
138
-
139
-
140
-
141
-
142
-
143
-
144
-
145
-
146
-
147
-
148
-
149
-
150
-
151
-
152
 |
 |

2008 Air Canada Annual Report
CII
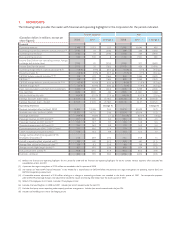
1. HIGHLIGHTS
The following table provides the reader with financial and operating highlights for the Corporation for the periods indicated.
(Canadian dollars in millions, except per
share figures)
Fourth Quarter Year
2008 2007 Change $ 2008 2007 (1) Change $
Financial
Operating revenues 2,498 2,513 (15) 11,082 10,646 436
Operating income (loss) before a special provision (2) (146) 72 (218) (39) 433 (472)
Operating income (loss) (146) 72 (218) (164) 433 (597)
Non-operating expenses (44) (52) 8 (170) (122) (48)
Income (loss) before non-controlling interest, foreign
exchange and income taxes
(190) 20 (210) (334) 311 (645)
Income (loss) for the period (727) 35 (762) (1,025) 429 (1,454)
Operating margin before a special provision % (2) -5.8 % 2.9 % (8.7) pp -0.4 % 4.1 % (4.5) pp
Operating margin % -5.8 % 2.9 % (8.7) pp -1.5 % 4.1 % (5.6) pp
EBITDAR before a special provision (2) (3) 108 274 (166) 934 1,263 (329)
EBITDAR (2) 108 274 (166) 809 1,263 (454)
EBITDAR margin before a special provision % (2) (3) 4.3 % 10.9 % (6.6) pp 8.4 % 11.9 % (3.5) pp
EBITDAR margin % (3) 4.3 % 10.9 % (6.6) pp 7.3 % 11.9 % (4.6) pp
Cash, cash equivalents and short-term investments 1,005 1,239 (234) 1,005 1,239 (234)
Free cash flow (428) (892) 464 (985) (2,233) 1,248
Adjusted debt/equity ratio 89.6 % 67.0 % 22.6 pp 89.6 % 67.0 % 22.6 pp
Earnings (loss) per share - basic ($7.27) $ 0.35 ($7.62) ($10.25) $4.29 ($14.54)
Earnings (loss) per share - diluted ($7.27) $ 0.35 ($7.62) ($10.25) $4.27 ($14.52)
Operating Statistics Change % Change %
Revenue passenger miles (millions) (RPM) 10,845 11,446 (5.3) 50,519 50,629 (0.2)
Available seat miles (millions) (ASM) 13,571 14,715 (7.8) 62,074 62,814 (1.2)
Passenger load factor 79.9 % 77.8 % 2.1 pp 81.4 % 80.6 % 0.8 pp
Passenger revenue per RPM (cents) (4) 20.1 18.9 6.2 19.2 18.4 4.3
Passenger revenue per ASM (cents) (4) 16.0 14.7 9.1 15.6 14.8 5.3
Operating revenue per ASM (cents) (4) 18.4 16.9 8.9 17.9 16.9 5.3
Operating expense per ASM ("CASM") (cents) 19.5 16.6 17.4 17.9 16.3 10.2
CASM, excluding fuel expense (cents) 13.6 12.4 9.9 12.4 12.2 1.7
Average number of full-time equivalent (FTE)
employees (thousands) (5) 23.6 23.9 (1.3) 24.2
23.9 1.1
Aircraft in operating fleet at period end (6) 333 340 (2.1) 333 340 (2.1)
Average fleet utilization (hours per day) (7) 8.8 9.3 (5.4) 9.6 9.8 (2.0)
Average aircraft flight length (miles) (7) 827 851 (2.8) 863 874 (1.3)
Fuel price per litre (cents) (8) 95.8 67.5 41.9 90.4 65.6 37.8
Fuel litres (millions) 822 905 (9.2) 3,763 3,873 (2.8)
(1) Reflects the financial and operating highlights for Air Canada for 2008 and the financial and operating highlights for the Air Canada Services segment, which excluded the
consolidation of Jazz, for 2007.
(2) A provision for cargo investigations of $125 million was recorded in the first quarter of 2008.
(3) See section 20 “Non-GAAP Financial Measures” in this MD&A for a reconciliation of EBITDAR before the provision for cargo investigations to operating income (loss) and
EBITDAR to operating income (loss).
(4) A favourable revenue adjustment of $26 million relating to a change in accounting estimates was recorded in the fourth quarter of 2007. For comparative purposes,
yield and RASM percentage changes were adjusted to include the impact of removing $26 million from the fourth quarter of 2007.
(5) Reflects FTE employees at Air Canada. Excludes FTE employees at Jazz.
(6) Excludes chartered freighters in 2008 and 2007. Includes Jazz aircraft covered under the Jazz CPA.
(7) Excludes third party carriers operating under capacity purchase arrangements. Includes Jazz aircraft covered under the Jazz CPA.
(8) Includes fuel handling and is net of fuel hedging results.