Adidas 2002 Annual Report Download - page 10
Download and view the complete annual report
Please find page 10 of the 2002 Adidas annual report below. You can navigate through the pages in the report by either clicking on the pages listed below, or by using the keyword search tool below to find specific information within the annual report.-
 1
1 -
 2
2 -
 3
3 -
 4
4 -
 5
5 -
 6
6 -
 7
7 -
 8
8 -
 9
9 -
 10
10 -
 11
11 -
 12
12 -
 13
13 -
 14
14 -
 15
15 -
 16
16 -
 17
17 -
 18
18 -
 19
19 -
 20
20 -
 21
21 -
22
-
23
-
24
-
25
-
26
-
27
-
28
-
29
-
30
-
31
-
32
-
33
-
34
-
35
-
36
-
37
-
38
-
39
-
40
-
41
-
42
-
43
-
44
-
45
-
46
-
47
-
48
-
49
-
50
-
51
-
52
-
53
-
54
-
55
-
56
-
57
-
58
-
59
-
60
-
61
-
62
-
63
-
64
-
65
-
66
-
67
-
68
-
69
-
70
-
71
-
72
-
73
-
74
-
75
-
76
-
77
-
78
-
79
-
80
-
81
-
82
-
83
-
84
-
85
-
86
-
87
-
88
-
89
-
90
-
91
-
92
-
93
-
94
-
95
-
96
-
97
-
98
-
99
-
100
-
101
-
102
-
103
-
104
-
105
-
106
-
107
-
108
-
109
-
110
-
111
-
112
-
113
-
114
-
115
-
116
-
117
-
118
-
119
-
120
-
121
-
122
-
123
-
124
-
125
-
126
-
127
-
128
-
129
-
130
-
131
-
132
-
133
-
134
-
135
-
136
-
137
-
138
-
139
-
140
-
141
-
142
-
143
-
144
-
145
-
146
-
147
-
148
-
149
-
150
-
151
-
152
-
153
-
154
-
155
-
156
-
157
-
158
-
159
-
160
 |
 |

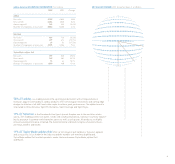
Financial Highlights
8PASSION FOR SPORT
NET SALES € in millions
1998 5,065
1999 5,354
2000 5,835
2001 6,112
2002 6,523
FINANCIAL HIGHLIGHTS
2002 2001 Change
Operating Highlights € in millions
Net sales 6,523 6,112 6.7%
Income before taxes 390 376 3.7%
Net income 229 208 9.6%
Key Ratios %
Gross margin 43.2 42.6 0.7pp
Selling, general and administrative
expenses as a percentage of net sales 34.4 33.3 1.1pp
EBITDA as a percentage of net sales 9.3 9.9 (0.6pp)
Effective tax rate 37.9 39.0 (1.1pp)
Net income as a percentage of net sales 3.5 3.4 0.1pp
Equity ratio 25.4 24.3 1.1pp
Balance Sheet Data € in millions
Total assets 4,261 4,183 1.9%
Inventories 1,190 1,273 (6.5%)
Receivables and other current assets 1,578 1,520 3.8%
Working capital 1,467 1,485 (1.2%)
Net total borrowings 1,498 1,679 (10.8%)
Shareholders’ equity 1,081 1,015 6.6%
Per Share of Common Stock €
Basic earnings per share 5.04 4.60 9.6%
Diluted earnings per share 5.04 ––
Basic earnings per share
(without goodwill amortization) 6.04 5.49 10.0%
Operating cash flow per share 11.77 8.47 1.4%
Dividend per share 1.001) 0.92 8.7%
Share price at year-end 82.30 84.30 (2.4%)
Other at year-end
Number of employees 14,716 13,941 5.6%
Number of shares outstanding 45,422,500 45,349,200 0.2%
Average number of shares 45,366,100 45,349,200 0.0%
Rounding differences may arise in percentages and totals for figures presented in
millions as calculation is always based on the figures stated in thousands.
1) Subject to Annual General Meeting approval
NET INCOME € in millions
1998 205
1999 228
2000 182
2001 208
2002 229