Adidas 2001 Annual Report Download - page 3
Download and view the complete annual report
Please find page 3 of the 2001 Adidas annual report below. You can navigate through the pages in the report by either clicking on the pages listed below, or by using the keyword search tool below to find specific information within the annual report.-
 1
1 -
 2
2 -
 3
3 -
 4
4 -
 5
5 -
 6
6 -
 7
7 -
 8
8 -
 9
9 -
 10
10 -
 11
11 -
 12
12 -
 13
13 -
 14
14 -
15
-
16
-
17
-
18
-
19
-
20
-
21
-
22
-
23
-
24
-
25
-
26
-
27
-
28
-
29
-
30
-
31
-
32
-
33
-
34
-
35
-
36
-
37
-
38
-
39
-
40
-
41
-
42
-
43
-
44
-
45
-
46
-
47
-
48
-
49
-
50
-
51
-
52
-
53
-
54
-
55
-
56
-
57
-
58
-
59
-
60
-
61
-
62
-
63
-
64
-
65
-
66
-
67
-
68
-
69
-
70
-
71
-
72
-
73
-
74
-
75
-
76
-
77
-
78
-
79
-
80
-
81
-
82
-
83
-
84
-
85
-
86
-
87
-
88
-
89
-
90
-
91
-
92
-
93
-
94
-
95
-
96
-
97
-
98
-
99
-
100
-
101
-
102
-
103
-
104
-
105
-
106
-
107
-
108
-
109
-
110
-
111
-
112
-
113
-
114
-
115
-
116
-
117
 |
 |

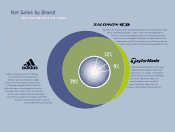
Financial Highlights (IAS)
Net Sales
(euros in millions)
5.22
4.52
5.02
4.01
4.60
1997
1998
1999
2000
2001
3,425
5,065
5,354
5,835
6,112
Earnings per Share
(euros)
2001 2000 Change
Operating Highlights (euros in millions)
Net sales 6,112 5,835 4.8%
Income before taxes 376 347 8.6%
Net income 208 182 14.8%
Key Ratios (in %)
Gross margin 42.6 43.3 (0.8pp)
SG&A expenses as a percent
of net sales 33.3 34.5 (1.2pp)
EBITDA as a percent of net sales 9.9 9.6 0.2pp
Effective tax rate 39.0 40.3 (1.2pp)
Net income as a percent of net sales 3.4 3.1 0.3pp
Equity ratio 24.3 20.3 4.0pp
Balance Sheet Data (euros in millions)
Total assets 4,183 4,018 4.1%
Inventories 1,273 1,294 (1.6%)
Receivables and other current assets 1,520 1,387 9.6%
Working capital 1,485 1,417 4.7%
Net total borrowings 1,679 1,791 (6.2%)
Shareholders’ equity 1,015 815 24.4%
Per Share of Common Stock (euros)
Earnings per share 4.60 4.01 14.8%
Operating cash flow per share 8.47 (0.23) –
Dividend per share 0.92* 0.92 –
Share price at year-end 84.30 66.00 28%
Employees
Number of employees at year-end 13,941 13,362 4.3%
Rounding differences may arise in percentages and totals for figures presented
in millions as calculation is always based on the figures stated in thousands.
* Subject to Annual General Meeting approval
1997
1998
1999
2000
2001