Access America 2007 Annual Report Download - page 55
Download and view the complete annual report
Please find page 55 of the 2007 Access America annual report below. You can navigate through the pages in the report by either clicking on the pages listed below, or by using the keyword search tool below to find specific information within the annual report.-
 1
1 -
2
-
3
-
4
-
5
-
6
-
7
-
8
-
9
-
10
-
11
-
12
-
13
-
14
-
15
-
16
-
17
-
18
-
19
-
20
-
21
-
22
-
23
-
24
-
25
-
26
-
27
-
28
-
29
-
30
-
31
-
32
-
33
-
34
-
35
-
36
-
37
-
38
-
39
-
40
-
41
-
42
-
43
-
44
-
 45
45 -
 46
46 -
 47
47 -
 48
48 -
 49
49 -
 50
50 -
 51
51 -
 52
52 -
 53
53 -
 54
54 -
 55
55 -
 56
56 -
 57
57 -
 58
58
 |
 |

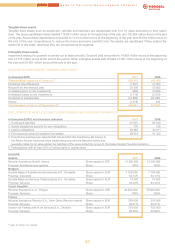
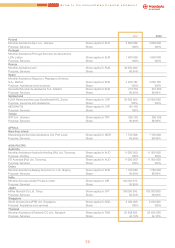
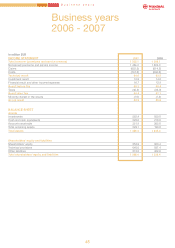
Business years
2006 - 2007
in million EUR
INCOME STATEMENT 2007 2006
Total turnover (premiums and service revenue) 1 523.1 1 366.1
Net earned premiums and service income 1 464.3 1 324.3
Claims (652.5) (614.2)
Costs (747.2) (646.6)
Technical result 64.6 63.5
Investment result 13.9 14.0
Financial result and other income/expenses 16.7 12.9
Result before Tax 95.2 90.4
Taxes (40.8) (33.3)
Result after Tax 54.4 57.1
Minority interest in the results (1.9) (1.3)
Group result 52.5 55.8
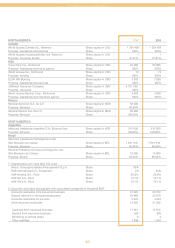
BALANCE SHEET
Assets
Investments 562.4 550.0
Cash and cash equivalents 225.0 218.0
Accounts receivable 351.9 265.6
Total remaining assets 229.1 199.8
Total assets 1 368.4 1 233.4
Shareholders' equity and liabilities
Shareholders' equity 353.9 323.4
Technical provisions 640.0 587.4
Other liabilities 374.5 322.6
Total shareholders' equity and liabilities 1 368.4 1 233.4
Business years
45