AIG 2014 Annual Report Download - page 2
Download and view the complete annual report
Please find page 2 of the 2014 AIG annual report below. You can navigate through the pages in the report by either clicking on the pages listed below, or by using the keyword search tool below to find specific information within the annual report.-
 1
1 -
 2
2 -
 3
3 -
 4
4 -
 5
5 -
 6
6 -
 7
7 -
 8
8 -
 9
9 -
 10
10 -
 11
11 -
 12
12 -
 13
13 -
14
-
15
-
16
-
17
-
18
-
19
-
20
-
21
-
22
-
23
-
24
-
25
-
26
-
27
-
28
-
29
-
30
-
31
-
32
-
33
-
34
-
35
-
36
-
37
-
38
-
39
-
40
-
41
-
42
-
43
-
44
-
45
-
46
-
47
-
48
-
49
-
50
-
51
-
52
-
53
-
54
-
55
-
56
-
57
-
58
-
59
-
60
-
61
-
62
-
63
-
64
-
65
-
66
-
67
-
68
-
69
-
70
-
71
-
72
-
73
-
74
-
75
-
76
-
77
-
78
-
79
-
80
-
81
-
82
-
83
-
84
-
85
-
86
-
87
-
88
-
89
-
90
-
91
-
92
-
93
-
94
-
95
-
96
-
97
-
98
-
99
-
100
-
101
-
102
-
103
-
104
-
105
-
106
-
107
-
108
-
109
-
110
-
111
-
112
-
113
-
114
-
115
-
116
-
117
-
118
-
119
-
120
-
121
-
122
-
123
-
124
-
125
-
126
-
127
-
128
-
129
-
130
-
131
-
132
-
133
-
134
-
135
-
136
-
137
-
138
-
139
-
140
-
141
-
142
-
143
-
144
-
145
-
146
-
147
-
148
-
149
-
150
-
151
-
152
-
153
-
154
-
155
-
156
-
157
-
158
-
159
-
160
-
161
-
162
-
163
-
164
-
165
-
166
-
167
-
168
-
169
-
170
-
171
-
172
-
173
-
174
-
175
-
176
-
177
-
178
-
179
-
180
-
181
-
182
-
183
-
184
-
185
-
186
-
187
-
188
-
189
-
190
-
191
-
192
-
193
-
194
-
195
-
196
-
197
-
198
-
199
-
200
-
201
-
202
-
203
-
204
-
205
-
206
-
207
-
208
-
209
-
210
-
211
-
212
-
213
-
214
-
215
-
216
-
217
-
218
-
219
-
220
-
221
-
222
-
223
-
224
-
225
-
226
-
227
-
228
-
229
-
230
-
231
-
232
-
233
-
234
-
235
-
236
-
237
-
238
-
239
-
240
-
241
-
242
-
243
-
244
-
245
-
246
-
247
-
248
-
249
-
250
-
251
-
252
-
253
-
254
-
255
-
256
-
257
-
258
-
259
-
260
-
261
-
262
-
263
-
264
-
265
-
266
-
267
-
268
-
269
-
270
-
271
-
272
-
273
-
274
-
275
-
276
-
277
-
278
-
279
-
280
-
281
-
282
-
283
-
284
-
285
-
286
-
287
-
288
-
289
-
290
-
291
-
292
-
293
-
294
-
295
-
296
-
297
-
298
-
299
-
300
-
301
-
302
-
303
-
304
-
305
-
306
-
307
-
308
-
309
-
310
-
311
-
312
-
313
-
314
-
315
-
316
-
317
-
318
-
319
-
320
-
321
-
322
-
323
-
324
-
325
-
326
-
327
-
328
-
329
-
330
-
331
-
332
-
333
-
334
-
335
-
336
-
337
-
338
-
339
-
340
-
341
-
342
-
343
-
344
-
345
-
346
-
347
-
348
-
349
-
350
-
351
-
352
-
353
-
354
-
355
-
356
-
357
-
358
-
359
-
360
-
361
-
362
-
363
-
364
-
365
-
366
-
367
-
368
-
369
-
370
-
371
-
372
-
373
-
374
-
375
-
376
-
377
-
378
 |
 |

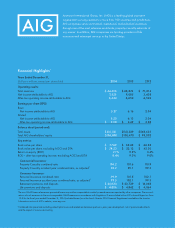
Financial Highlights1
American International Group, Inc. (AIG) is a leading global insurance
organization serving customers in more than 100 countries and jurisdictions.
AIG companies serve commercial, institutional, and individual customers
through one of the most extensive worldwide property-casualty networks of
any insurer. In addition, AIG companies are leading providers of life
insurance and retirement services in the United States.
Years Ended December 31,
(dollars in millions, except per share data) 2 014 2013 2 012
Operating results:
Total revenues $ 64,406 $ 68,874 $ 71,214
Net income attributable to AIG 7, 5 2 9 9,085 3,438
After-tax operating income attributable to AIG 6,630 6,650 6,542
Earnings per share (EPS):
Basic
Net income attributable to AIG 5.27 6.16 2.04
Diluted
Net income attributable to AIG 5.20 6.13 2.04
After-tax operating income attributable to AIG $ 4.58 $ 4.49 $ 3.88
Balance sheet (period-end):
Total assets $ 515,581 $ 541,329 $ 548,633
Total AIG shareholders’ equity $ 106,898 $ 100,470 $ 98,002
Key metrics:
Book value per share $ 77.69 $ 68.62 $ 66.38
Book value per share, excluding AOCI and DTA $ 58.23 $ 52.12 $ 45.30
Return on equity (ROE) 7.1% 9.2% 3.4%
ROE – after-tax operating income, excluding AOCI and DTA 8.4% 9.3% 9.0%
Commercial Insurance:
Property Casualty combined ratio 100.2 101.6 110.9
Property Casualty accident year combined ratio, as adjusted2 94.2 95.1 99.3
Consumer Insurance:
Personal Insurance combined ratio 99.9 101.5 102.1
Personal Insurance accident year combined ratio, as adjusted2 99.5 102.1 99.3
Retirement premiums and deposits $ 24,023 $ 23,729 $ 16,048
Life premiums and deposits $ 4,806 $ 4,862 $ 4,864
1The non-GAAP financial measures presented herein may not be comparable to similarly-named measures reported by other companies. The reconcil-
iations of such measures to the most comparable GAAP measures in accordance with Regulation G are included within AIG’s Annual Report on Form
10-K for the fiscal year ended December 31, 2014 (included herein) or in the Fourth Quarter 2014 Financial Supplement available in the Investor
Information section of AIG’s website, www.aig.com.
2Combined ratio presented excluding catastrophe losses and related reinstatement premiums, prior year development, net of premium adjustments
and the impact of reserve discounting.