3M 2005 Annual Report Download - page 75
Download and view the complete annual report
Please find page 75 of the 2005 3M annual report below. You can navigate through the pages in the report by either clicking on the pages listed below, or by using the keyword search tool below to find specific information within the annual report.-
 1
1 -
2
-
3
-
4
-
5
-
6
-
7
-
8
-
9
-
10
-
11
-
12
-
13
-
14
-
15
-
16
-
17
-
18
-
19
-
20
-
21
-
22
-
23
-
24
-
25
-
26
-
27
-
28
-
29
-
30
-
31
-
32
-
33
-
34
-
35
-
36
-
37
-
38
-
39
-
40
-
41
-
42
-
43
-
44
-
45
-
46
-
47
-
48
-
49
-
50
-
51
-
52
-
53
-
54
-
55
-
56
-
57
-
58
-
59
-
60
-
61
-
62
-
63
-
64
-
 65
65 -
 66
66 -
 67
67 -
 68
68 -
 69
69 -
 70
70 -
 71
71 -
 72
72 -
 73
73 -
 74
74 -
 75
75 -
 76
76 -
 77
77 -
 78
78 -
 79
79 -
 80
80 -
 81
81 -
 82
82 -
 83
83 -
 84
84 -
 85
85 -
86
-
87
-
88
-
89
-
90
-
91
-
92
-
93
-
94
-
95
-
96
-
97
-
98
-
99
-
100
-
101
-
102
-
103
-
104
-
105
-
106
-
107
-
108
 |
 |

49
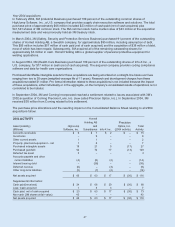
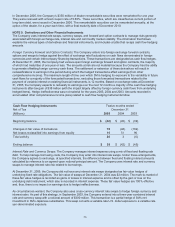
NOTE 3. Goodwill and Intangible Assets
Purchased goodwill from acquisitions totaled $1.002 billion in 2005, primarily related to CUNO. None of the goodwill in
2005 and 2004 is deductible for tax purposes. Changes in foreign currency exchange rates impacted both 2005 and
2004 goodwill balances. The goodwill balance by business segment follows:
Goodwill 2004 2005
2004 trans- 2005 trans-
Dec. 31, acqui- lation Dec. 31, acqui- lation Dec. 31,
2003 sition and 2004 sition and 2005
(Millions) balance activity other balance activity other balance
Health Care $ 513 $ 17 $ 45 $ 575 $ – $ (66) $ 509
Industrial 264 52 29 345 992 (24) 1,313
Display and Graphics 903 (13) (5) 885 – (14) 871
Consumer and Office 56 – 3 59 – (5) 54
Electro and Communications 553 – 13 566 10 (51) 525
Safety, Security and
Protection Services 100 72 21 193 – (21) 172
Transportation 30 – 2 32 – (3) 29
Total Company $2,419 $128 $108 $2,655 $1,002 $(184) $ 3,473
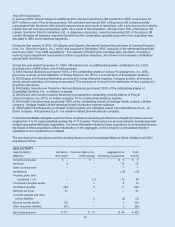
Acquired Intangible Assets
The carrying amount and accumulated amortization of acquired intangible assets as of December 31 follow:
(Millions) 2005 2004
Patents $378 $330
Other amortizable intangible assets (primarily
tradenames and customer related intangibles) 369 162
Non-amortizable intangible assets (tradenames) 60 69
Total gross carrying amount $807 $561
Accumulated amortization – patents (205) (187)
Accumulated amortization – other (116) (97)
Total accumulated amortization (321) (284)
Total intangible assets – net $486 $277
Amortization expense for acquired intangible assets for the years ended December 31 follows:
(Millions) 2005 2004 2003
Amortization expense $48 $43 $41
Expected amortization expense for acquired intangible assets recorded as of December 31, 2005 follows:
After
(Millions) 2006 2007 2008 2009 2010 2010
Amortization expense $50 $44 $42 $40 $40 $210
The preceding expected amortization expense is an estimate. Actual amounts of amortization expense may differ
from estimated amounts due to additional intangible asset acquisitions, changes in foreign currency exchange rates,
impairment of intangible assets, accelerated amortization of intangible assets and other events.