3M 2005 Annual Report Download - page 44
Download and view the complete annual report
Please find page 44 of the 2005 3M annual report below. You can navigate through the pages in the report by either clicking on the pages listed below, or by using the keyword search tool below to find specific information within the annual report.
18
Currency Effects:
3M estimates that year-on-year currency effects, including hedging impacts, increased net income by approximately
$115 million in 2005, $181 million in 2004 and $73 million in 2003. This estimate includes the effect of translating profits
from local currencies into U.S. dollars; the impact of currency fluctuations on the transfer of goods between 3M
operations in the United States and abroad; and transaction gains and losses, including derivative instruments
designed to reduce foreign currency exchange rate risks. 3M estimates that year-on-year derivative and other
transaction gains and losses increased net income by approximately $50 million for 2005 and $48 million in 2004. 3M
estimates that year-on-year derivative and other transaction gains and losses decreased net income by $73 million in
2003.
PERFORMANCE BY BUSINESS SEGMENT
Effective January 1, 2006, 3M combined its Industrial and Transportation business segments. This new segment will
leverage common markets, sales channels and customers, technologies, manufacturing facilities and selling
processes. This combination will provide additional efficiencies that will be reinvested in growth. The results for the new
Industrial and Transportation segment can be approximated by combining the existing Industrial and Transportation
segments. In addition, during the first quarter of 2006, the Personal Care Division (2005 annual sales of approximately
$600 million) within the Health Care segment transferred to the combined Industrial and Transportation segment.
Segment information for all periods presented will be reclassified in 2006 to reflect the combined Industrial and
Transportation segment in addition to the transfer of the Personal Care Division.
Disclosures relating to 3M’s business segments are provided in Item 1, Business Segments. Financial information
and other disclosures are provided in the Notes to the Consolidated Financial Statements. In 2005, 3M managed
its operations in seven operating business segments: Health Care; Industrial; Display and Graphics; Consumer and
Office; Electro and Communications; Safety, Security and Protection Services; and Transportation. Information
related to 3M’s business segments is presented in the tables that follow. Local-currency sales (which include both
core and acquisition volume impacts, plus price impacts) are provided for each segment. The translation impact
and total sales change are also provided for each segment.
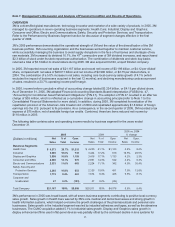
Health Care Business (20.7% of consolidated sales):
2005 2004 2003
Sales (millions) $4,373 $4,230 $3,995
Sales change analysis:
Local currency (volume and price) 2.9% 1.7% 6.0%
Translation 0.5 4.2 6.2
Total sales change 3.4% 5.9% 12.2%
Operating income (millions) $1,215 $1,123 $1,027
Percent change 8.2% 9.3% 14.1%
Percent of sales 27.8% 26.5% 25.7%
The Health Care segment serves markets that include medical, surgical, pharmaceutical, dental and orthodontic,
health information systems and personal care. Products provided to these markets include medical and surgical
supplies, skin health and infection prevention products, pharmaceuticals, drug delivery systems, dental and orthodontic
products, health information systems, microbiology products, and closures for disposable diapers.
In 2005, Health Care reported local-currency sales growth of 2.9%. 3M’s core medical and dental businesses and
health information systems businesses experienced local-currency sales growth of approximately 6%. The strength of
these businesses helped overcome the sales growth challenges of the pharmaceutical and personal care businesses.
Personal care, which is 3M’s diaper tape business, has experienced significant raw material price increases in some
product lines over the past year, and 3M has elected to drive profits at the expense of volume in this business, which
has the lowest margins in the Health Care segment. Sales of certain products within 3M’s pharmaceuticals
business, primarily comprised of prescription drugs in inhalation, women’s health, and cardiovascular, are
declining due to price pressure in Europe and decreased demand for some of these older products. 3M continues
to generate growth in its Aldara™ pharmaceutical product, which accounts for approximately 6% of total Health Care
sales. Aldara sales grew nearly 10% in 2005, and growth outside the U.S. was particularly strong. However, fourth
quarter 2005 year-over-year local-currency sales declined for the first time since the product was launched in 1997.
Health Care sales for 3M’s Aldara pharmaceutical product for the actinic keratois (a pre-cancerous skin condition)


