3M 2005 Annual Report Download - page 101
Download and view the complete annual report
Please find page 101 of the 2005 3M annual report below. You can navigate through the pages in the report by either clicking on the pages listed below, or by using the keyword search tool below to find specific information within the annual report.-
 1
1 -
2
-
3
-
4
-
5
-
6
-
7
-
8
-
9
-
10
-
11
-
12
-
13
-
14
-
15
-
16
-
17
-
18
-
19
-
20
-
21
-
22
-
23
-
24
-
25
-
26
-
27
-
28
-
29
-
30
-
31
-
32
-
33
-
34
-
35
-
36
-
37
-
38
-
39
-
40
-
41
-
42
-
43
-
44
-
45
-
46
-
47
-
48
-
49
-
50
-
51
-
52
-
53
-
54
-
55
-
56
-
57
-
58
-
59
-
60
-
61
-
62
-
63
-
64
-
65
-
66
-
67
-
68
-
69
-
70
-
71
-
72
-
73
-
74
-
75
-
76
-
77
-
78
-
79
-
80
-
81
-
82
-
83
-
84
-
85
-
86
-
87
-
88
-
89
-
90
-
 91
91 -
 92
92 -
 93
93 -
 94
94 -
 95
95 -
 96
96 -
 97
97 -
 98
98 -
 99
99 -
 100
100 -
 101
101 -
 102
102 -
 103
103 -
 104
104 -
 105
105 -
 106
106 -
 107
107 -
 108
108
 |
 |

75
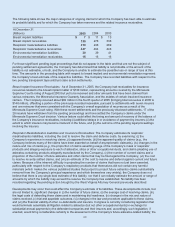
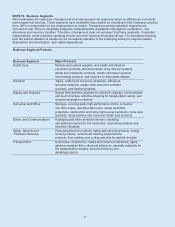
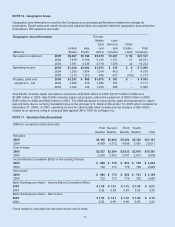
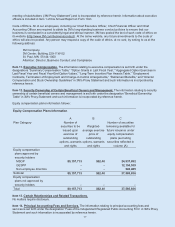
NOTE 16. Geographic Areas
Geographic area information is used by the Company as a secondary performance measure to manage its
businesses. Export sales and certain income and expense items are reported within the geographic area where the
final sales to 3M customers are made.
Geographic Area Information Europe,
Middle Latin
East America Other
United Asia and and Unallo- Total
(Millions) States Pacific Africa Canada cated Company
Net sales to customers 2005 $8,267 $5,744 $5,219 $1,881 $ 56 $21,167
2004 7,878 5,168 5,183 1,731 51 20,011
2003 7,581 4,335 4,718 1,556 42 18,232
Operating Income 2005 $1,324 $2,093 $1,073 $ 519 $ 0 $ 5,009
2004 1,200 1,874 1,014 483 7 4,578
2003 1,213 1,373 809 427 (109) 3,713
Property, plant and 2005 $3,291 $ 865 $1,076 $ 361 $ – $ 5,593
equipment – net 2004 3,290 810 1,288 323 – 5,711
2003 3,342 724 1,235 308 – 5,609
Asia Pacific includes Japan net sales to customers of $2,094 million in 2005, $2,077 million in 2004 and
$1,860 million in 2003. Asia Pacific includes Japan net property, plant and equipment of $350 million in 2005,
$397 million in 2004 and $362 million in 2003. The 2005 decrease in net property, plant and equipment in Japan
was primarily due to currency translation (due to the stronger U.S. dollar at December 31, 2005 when compared to
December 31, 2004). In 2003, operating income for other unallocated includes pre-tax charges of $93 million
related to an adverse ruling in a lawsuit filed against 3M in 1997 by LePage’s Inc.
NOTE 17. Quarterly Data (Unaudited)
(Millions, except per-share amounts)
First Second Third Fourth
Quarter Quarter Quarter Quarter Year
Net sales
2005 $5,166 $5,294 $5,382 $5,325 $21,167
2004 4,939 5,012 4,969 5,091 20,011
Cost of sales
2005 $2,537 $2,594 $2,632 $2,618 $10,381
2004 2,436 2,452 2,457 2,613 9,958
Income Before Cumulative Effect of Accounting Change
2005 $ 809 $ 776 $ 853 $ 796 $ 3,234
2004 722 773 775 720 2,990
Net income
2005 $ 809 $ 776 $ 853 $ 761 $ 3,199
2004 722 773 775 720 2,990
Basic Earnings per share – Income Before Cumulative Effect
2005 $ 1.05 $ 1.01 $ 1.12 $ 1.05 $ 4.23
2004 0.92 0.99 0.99 0.93 3.83
Basic Earnings per share – Net Income
2005 $ 1.05 $ 1.01 $ 1.12 $ 1.00 $ 4.18
2004 0.92 0.99 0.99 0.93 3.83
Gross margin is calculated as net sales minus cost of sales.