3M 2005 Annual Report Download - page 42
Download and view the complete annual report
Please find page 42 of the 2005 3M annual report below. You can navigate through the pages in the report by either clicking on the pages listed below, or by using the keyword search tool below to find specific information within the annual report.-
 1
1 -
2
-
3
-
4
-
5
-
6
-
7
-
8
-
9
-
10
-
11
-
12
-
13
-
14
-
15
-
16
-
17
-
18
-
19
-
20
-
21
-
22
-
23
-
24
-
25
-
26
-
27
-
28
-
29
-
30
-
31
-
 32
32 -
 33
33 -
 34
34 -
 35
35 -
 36
36 -
 37
37 -
 38
38 -
 39
39 -
 40
40 -
 41
41 -
 42
42 -
 43
43 -
 44
44 -
 45
45 -
 46
46 -
 47
47 -
 48
48 -
 49
49 -
 50
50 -
 51
51 -
 52
52 -
53
-
54
-
55
-
56
-
57
-
58
-
59
-
60
-
61
-
62
-
63
-
64
-
65
-
66
-
67
-
68
-
69
-
70
-
71
-
72
-
73
-
74
-
75
-
76
-
77
-
78
-
79
-
80
-
81
-
82
-
83
-
84
-
85
-
86
-
87
-
88
-
89
-
90
-
91
-
92
-
93
-
94
-
95
-
96
-
97
-
98
-
99
-
100
-
101
-
102
-
103
-
104
-
105
-
106
-
107
-
108
 |
 |

16
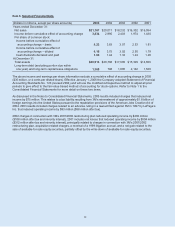
In 2004, core volume growth (which excludes the impact of businesses acquired in the last 12 months) was broad-
based, with all seven businesses posting worldwide local-currency sales growth. Local-currency growth was led by
Display and Graphics; Industrial; Consumer and Office; Safety, Security and Protection Services; and the
Transportation businesses. Health Care local-currency sales increased 1.7%, as results were negatively impacted by
2003 sales from pharmaceutical and drug delivery agreements that did not repeat in 2004. Electro and
Communications local-currency sales increased 2.7%, the first year of positive local-currency sales growth since
2000. Acquisitions increased 2004 sales by 0.5%, driven by the 2004 acquisitions of HighJump Software, Inc. and
Hornell Holding AB. Internationally, selling prices declined 1.1%, with most of the decline coming in certain businesses
that serve the electronics industry, where it is important to look at the combined impact of volume and price. On a
geographic basis, local-currency sales growth in 2004 was led by the Asia Pacific area.
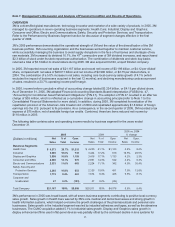
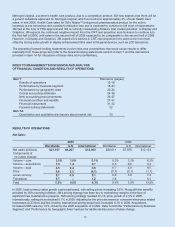
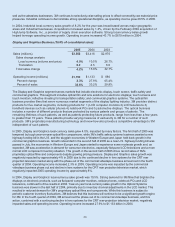
Operating Expenses:
(Percent of net sales) 2005 2004
versus versus
2005 2004 2003 2004 2003
Cost of sales 49.0% 49.8% 50.9% (0.8)% (1.1)%
Selling, general and administrative expenses 21.4 21.4 21.9 – (0.5)
Research, development and related expenses 5.9 5.9 6.3 – (0.4)
Other expense – – 0.5 – (0.5)
Operating income 23.7 22.9 20.4 0.8 2.5
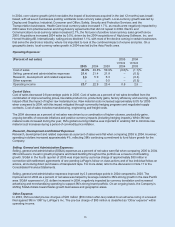
Cost of Sales:
Cost of sales decreased 0.8 percentage points in 2005. Cost of sales as a percent of net sales benefited from the
combination of improved selling prices, favorable product mix, productivity gains, factory efficiency and sourcing, which
helped offset the impact of higher raw material prices. Raw material costs increased approximately 6.0% for 2005
when compared to 2004, with this impact mitigated through commodity hedging programs and negotiated supply
contracts. Cost of sales includes manufacturing, engineering and freight costs.
The 2004 decrease as a percent of net sales was driven by a combination of higher volumes, productivity gains,
ongoing benefits of corporate initiatives and positive currency impacts (including hedging impacts). While 3M raw
material costs increased during the year, 3M’s global sourcing initiative was important in enabling 3M to minimize raw
material cost increases during a period of commodity price inflation.
Research, Development and Related Expenses:
Research, development and related expenses as a percent of sales were flat when comparing 2005 to 2004. However,
spending in dollars increased approximately 4%, reflecting 3M’s continuing commitment to fund future growth for the
Company.
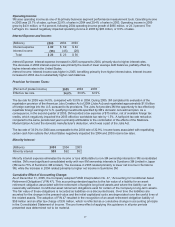
Selling, General and Administrative Expenses:
Selling, general and administrative (SG&A) expenses as a percent of net sales were flat when comparing 2005 to 2004.
3M continues to invest in growth programs and brand building throughout the portfolio as a means of stimulating
growth. SG&A in the fourth quarter of 2005 was impacted by a pre-tax charge of approximately $30 million in
connection with settlement agreements of one pending LePage’s follow-on class actions and of two individual follow-on
actions, all involving direct purchasers of transparent tape. For more detail, refer to the discussion in Note 11 to the
Consolidated Financial Statements.
Selling, general and administrative expenses improved by 0.5 percentage points in 2004 compared to 2003. The
improvement in 2004 as a percent of net sales was helped by leverage related to 3M’s strong growth in the Asia Pacific
area. SG&A expenses in U.S. dollars increased in 2004, negatively impacted by currency translation and increased
advertising and merchandising spending to support 3M’s strong brand portfolio. On an ongoing basis, the Company is
shifting SG&A dollars toward faster-growth businesses and geographic areas.
Other Expense:
In 2003, 3M recorded pre-tax charges of $93 million ($58 million after-tax) related to an adverse ruling in a lawsuit
filed against 3M in 1997 by LePage’s Inc. The pre-tax charge of $93 million is classified as “Other expense” within
operating income.