Whirlpool 2008 Annual Report Download - page 92
Download and view the complete annual report
Please find page 92 of the 2008 Whirlpool annual report below. You can navigate through the pages in the report by either clicking on the pages listed below, or by using the keyword search tool below to find specific information within the annual report.-
 1
1 -
2
-
3
-
4
-
5
-
6
-
7
-
8
-
9
-
10
-
11
-
12
-
13
-
14
-
15
-
16
-
17
-
18
-
19
-
20
-
21
-
22
-
23
-
24
-
25
-
26
-
27
-
28
-
29
-
30
-
31
-
32
-
33
-
34
-
35
-
36
-
37
-
38
-
39
-
40
-
41
-
42
-
43
-
44
-
45
-
46
-
47
-
48
-
49
-
50
-
51
-
52
-
53
-
54
-
55
-
56
-
57
-
58
-
59
-
60
-
61
-
62
-
63
-
64
-
65
-
66
-
67
-
68
-
69
-
70
-
71
-
72
-
73
-
74
-
75
-
76
-
77
-
78
-
79
-
80
-
81
-
 82
82 -
 83
83 -
 84
84 -
 85
85 -
 86
86 -
 87
87 -
 88
88 -
 89
89 -
 90
90 -
 91
91 -
 92
92 -
 93
93 -
 94
94 -
 95
95 -
 96
96 -
 97
97 -
 98
98 -
 99
99 -
 100
100 -
 101
101 -
 102
102 -
103
-
104
 |
 |

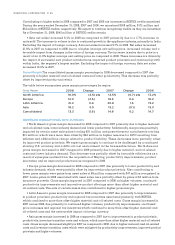
The graph below depicts the yearly dollar change in the cumulative total stockholder return on our
common stock with the cumulative total return of Standard & Poor's (S&P) Composite 500 Stock Index,
the S&P Household Appliances Group Index and the cumulative total return of the S&P 500 Household
Durables Index for the years 2004 through 2008.* The graph assumes $100 was invested in December 31,
2003, in Whirlpool common stock, the S&P 500 and the S&P Household Appliances Group. Beginning in
2008, and going forward, Whirlpool Corporation intends to replace the S&P Household Appliances Group
with the S&P 500 Household Durables Index. Whirlpool Corporation believes the durables index provides
a broader and more appropriate comparator group than the S&P Household Appliances Index.
* Cumulative total return is measured by dividing: (1) the sum of (a) the cumulative amount of the dividends for the measurement period,
assuming dividend reinvestment, and (b) the difference between share price at the end and at the beginning of the measurement period by
(2) the share price at the beginning of the measurement period.
Base
Period
Years
Ending
This document contains forward-looking statements that speak only as of this date. Whirlpool disclaims any obligation to
update these statements. Forward-looking statements in this document may include, but are not limited to, statements regarding
expected earnings per share, cash flow, productivity and material and oil-related prices. Many risks, contingencies and
uncertainties could cause actual results to differ materially from Whirlpool Corporation's forward-looking statements. Among
these factors are: (1) changes in economic conditions which affect demand for our products, including the strength of the
building industry and the level of interest rates; (2) the effects of the global economic crisis on our customers, suppliers and the
availability of credit; (3) Whirlpool's ability to continue its relationship with significant trade customers, including Sears Holding
Corporation in North America (accounting for approximately 11% of Whirlpool's 2008 consolidated net sales of $18.9 billion) and
the ability of these trade customers to maintain or increase market share; (4) intense competition in the home appliance industry
reflecting the impact of both new and established global competitors, including Asian and European manufacturers; (5) the ability
of Whirlpool to manage foreign currency fluctuations; (6) litigation including product liability and product defect claims;
(7) the ability of Whirlpool to achieve its business plans, productivity improvements, cost control, leveraging of its global operating
platform, and acceleration of the rate of innovation; (8) fluctuations in the cost of key materials (including steel, oil, plastic,
resins, copper and aluminum) and components and the ability of Whirlpool to offset cost increases; (9) the ability of suppliers
of critical parts, components and manufacturing equipment to deliver sufficient quantities to Whirlpool in a timely and cost-
effective manner; (10) health care cost trends and regulatory changes that could increase future funding obligations for pension
and post retirement benefit plans; (11) Whirlpool's ability to obtain and protect intellectual property rights; (12) global, political
and/or economic uncertainty and disruptions, especially in Whirlpool's significant geographic regions, including uncertainty
and disruptions arising from natural disasters or terrorist attacks; (13) the effects of governmental investigations or related
actions by third parties; (14) the impact of labor relations; (15) our ability to attract, develop and retain executives and other
qualified employees; (16) the cost of compliance with environmental and health and safety regulations. Additional information
concerning these and other factors can be found in Whirlpool Corporation's filings with the Securities and Exchange Commission,
including the most recent annual report on Form 10-K, quarterly reports on Form 10-Q, and current reports on Form 8-K.