Whirlpool 2008 Annual Report Download - page 89
Download and view the complete annual report
Please find page 89 of the 2008 Whirlpool annual report below. You can navigate through the pages in the report by either clicking on the pages listed below, or by using the keyword search tool below to find specific information within the annual report.-
 1
1 -
2
-
3
-
4
-
5
-
6
-
7
-
8
-
9
-
10
-
11
-
12
-
13
-
14
-
15
-
16
-
17
-
18
-
19
-
20
-
21
-
22
-
23
-
24
-
25
-
26
-
27
-
28
-
29
-
30
-
31
-
32
-
33
-
34
-
35
-
36
-
37
-
38
-
39
-
40
-
41
-
42
-
43
-
44
-
45
-
46
-
47
-
48
-
49
-
50
-
51
-
52
-
53
-
54
-
55
-
56
-
57
-
58
-
59
-
60
-
61
-
62
-
63
-
64
-
65
-
66
-
67
-
68
-
69
-
70
-
71
-
72
-
73
-
74
-
75
-
76
-
77
-
78
-
 79
79 -
 80
80 -
 81
81 -
 82
82 -
 83
83 -
 84
84 -
 85
85 -
 86
86 -
 87
87 -
 88
88 -
 89
89 -
 90
90 -
 91
91 -
 92
92 -
 93
93 -
 94
94 -
 95
95 -
 96
96 -
 97
97 -
 98
98 -
 99
99 -
100
-
101
-
102
-
103
-
104
 |
 |

We have continued to experience intensified macroeconomic challenges in North America and are
now experiencing similar macroeconomic challenges in the European market. These conditions are
primarily related to higher than expected material and oil-related costs and decreased consumer
demand for our products.
For the year ended December 31, 2009, we currently estimate earnings per diluted share from continuing
operations to be in the range of $3.00 to $4.00, and free cash flow for the year to be from $300 to $400
million. Within North America and Europe we expect industry demand to decline 10% and 8% in 2009,
respectively, while Latin America and Asia are currently expected to be flat to down 5% for the year.
Material cost inflation is expected to be approximately $200 million in 2009, largely driven by increases
in component parts, steel and base metals, such as copper, aluminum, zinc and nickel. We expect to
offset these higher costs with productivity improvements, new product introductions, previously
implemented cost-based price adjustments, improved product price/mix and administrative and
infrastructure cost reductions. Our innovation product pipeline continues to grow and drive higher
average sales values, consumer and trade response to our new product offerings has been positive,
and we continue to accelerate our global branded consumer products strategy of delivering relevant
innovation to markets worldwide.
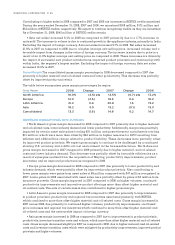
The table below reconciles projected 2009 cash provided by continuing operations determined in
accordance with generally accepted accounting principles (GAAP) in the United States to free cash
flow, a non-GAAP measure. Management believes that free cash flow provides shareholders with a
relevant measure of liquidity and a useful basis for assessing Whirlpool’s ability to fund its activities
and obligations. There are limitations to using non-GAAP financial measures, including the difficulty
associated with comparing companies that use similarly named non-GAAP measures whose calculations
may differ from our calculations. We define free cash flow as cash provided by continuing operations
after capital expenditures and proceeds from the sale of assets/businesses. The projections shown
here are based upon many estimates and are inherently subject to change based on future decisions
made by management and the board of directors of Whirlpool, and significant economic, competitive
and other uncertainties and contingencies.
(Millions of dollars)
Our objective is to finance our business through operating cash flow and the appropriate mix of long-term
and short-term debt. By diversifying the maturity structure, we avoid concentrations of debt, reducing
liquidity risk. We have varying needs for short-term working capital financing as a result of the nature
of our business. The volume and timing of refrigeration and air conditioning production impacts our
cash flows and consists of increased production in the first half of the year to meet increased demand
in the summer months.
The funding markets have been volatile in recent quarters and we have experienced negative global
economic trends. To succeed in this environment we are aggressively taking steps to further reduce all
areas of cost, production capacity, working capital and capital expenditures. As a result of the global
volatility and challenging economic trends, we decided to exit the commercial paper market during
the December 2008 quarter and initiated borrowing under our $2.2 billion committed bank line of credit,
provided by a syndicate of highly-rated banks. This facility matures in December 2010. Outside the
U.S., short-term funding is provided by bank borrowings on uncommitted lines of credit.
We expect borrowings under our $2.2 billion revolving credit facility will increase to an amount up to
$1.2 billion over the course of this year based upon our current business plans and normal seasonal
working capital requirements. Borrowings on our revolving credit facility are being utilized for general
corporate purposes, are used to ensure daily liquidity and may be borrowed and repaid from time
to time. Amounts borrowed on our revolving credit facility up to $1.1 billion bear interest at LIBOR +
0.475%, and if amounts borrowed exceed $1.1 billion, total borrowings bear interest at LIBOR + 0.60%.