Whirlpool 2008 Annual Report Download - page 87
Download and view the complete annual report
Please find page 87 of the 2008 Whirlpool annual report below. You can navigate through the pages in the report by either clicking on the pages listed below, or by using the keyword search tool below to find specific information within the annual report.-
 1
1 -
2
-
3
-
4
-
5
-
6
-
7
-
8
-
9
-
10
-
11
-
12
-
13
-
14
-
15
-
16
-
17
-
18
-
19
-
20
-
21
-
22
-
23
-
24
-
25
-
26
-
27
-
28
-
29
-
30
-
31
-
32
-
33
-
34
-
35
-
36
-
37
-
38
-
39
-
40
-
41
-
42
-
43
-
44
-
45
-
46
-
47
-
48
-
49
-
50
-
51
-
52
-
53
-
54
-
55
-
56
-
57
-
58
-
59
-
60
-
61
-
62
-
63
-
64
-
65
-
66
-
67
-
68
-
69
-
70
-
71
-
72
-
73
-
74
-
75
-
76
-
 77
77 -
 78
78 -
 79
79 -
 80
80 -
 81
81 -
 82
82 -
 83
83 -
 84
84 -
 85
85 -
 86
86 -
 87
87 -
 88
88 -
 89
89 -
 90
90 -
 91
91 -
 92
92 -
 93
93 -
 94
94 -
 95
95 -
 96
96 -
 97
97 -
98
-
99
-
100
-
101
-
102
-
103
-
104
 |
 |

Contributing to higher sales in 2008 compared to 2007 and 2006 are increases in BEFIEX credits monetized.
During the years ended December 31, 2008, 2007 and 2006, we monetized $168 million, $131 million and
$52 million of BEFIEX credits, respectively. We expect to continue recognizing credits as they are monetized.
As of December 31, 2008, $542 million of BEFIEX credits remain.
• Asia net sales increased 6.5% in 2008 as compared to 2007 primarily due to a 5.7% increase in
units sold. The increase in volume is due to continued growth in the appliance industry, primarily in India.
Excluding the impact of foreign currency, Asia net sales increased 9.7% in 2008. Net sales increased
21.9% in 2007 as compared to 2006 due to a higher average unit selling price, increased volume and a
favorable impact from changes in the value of foreign currency. The increase in sales due to price is a
result of an 11.8% higher average unit selling price as compared to 2006. These increases are driven by
the impact of successful new product introductions, improved product price/mix and continued growth
within India, the segment’s largest market. Excluding the impact of foreign currency, Asia net sales
increased 12.9% in 2007.
The consolidated gross margin percentage in 2008 decreased compared to 2007 due
primarily to higher material and oil-related costs and lower productivity. This decrease was partially
offset by improved product price/mix.
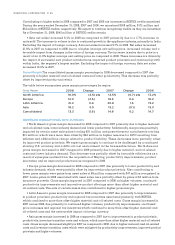
The table below summarizes gross margin percentages by region:
Gross Margin
• North America gross margin decreased in 2008 compared to 2007 primarily due to higher material
and oil-related costs, lower industry demand and lower productivity. Additionally, margin was positively
impacted by certain asset sale gains totaling $31 million and postretirement curtailments totaling
$15 million, which were more than offset by $42 million in higher reserves for LIFO resulting from
inflation and a $32 million charge related to product liability. These decreases were partially offset
by improved product price/mix. We expect gross margin to continue to be challenged by a continued
slowing U.S. economy and a difficult cost environment in the foreseeable future. North America
gross margin decreased in 2007 compared to 2006 primarily due to higher material- and oil-related
costs and lower industry demand. This decrease was partially offset by favorable efficiencies as a
result of synergies realized from the acquisition of Maytag, productivity improvements, product
innovation and an improved product mix as compared to 2006.
• Europe gross margin decreased in 2008 compared to 2007 due primarily to lower productivity and
industry demand, which were partially offset by improved product price/mix. Also contributing to
lower gross margin were gains from asset sales of $9 million compared with $47 million recognized in
2007. Lower gains in 2008 associated with asset sales were partially offset by gains of $5 million from
insurance proceeds. Gross margin improved in 2007 compared to 2006 as higher volumes, continued
productivity improvements and innovative product offerings more than offset higher material and
oil-related costs. The sale of certain assets also contributed to higher gross margin.
• Latin America gross margin increased in 2008 compared to 2007 due primarily to improvements
in product price/mix, productivity and regional tax incentives associated primarily with BEFIEX,
which combined to more than offset higher material and oil-related costs. Gross margin increased in
2007 versus 2006, due primarily to continued higher volumes, productivity improvements, cost based
price increases and regional tax incentives which combined to more than offset higher material and
oil-related costs and the unfavorable impact of foreign currency.
• Asia gross margin increased in 2008 as compared to 2007 due to improvements in product price/mix,
productivity, inventory transition costs and volume, which more than offset higher material and oil-related
costs. Gross margin decreased slightly in 2007 as compared to 2006, due to higher material and oil-related
costs and inventory transition costs which were mitigated by productivity improvements, improved product
price/mix and higher volumes.