Whirlpool 2008 Annual Report Download - page 86
Download and view the complete annual report
Please find page 86 of the 2008 Whirlpool annual report below. You can navigate through the pages in the report by either clicking on the pages listed below, or by using the keyword search tool below to find specific information within the annual report.-
 1
1 -
2
-
3
-
4
-
5
-
6
-
7
-
8
-
9
-
10
-
11
-
12
-
13
-
14
-
15
-
16
-
17
-
18
-
19
-
20
-
21
-
22
-
23
-
24
-
25
-
26
-
27
-
28
-
29
-
30
-
31
-
32
-
33
-
34
-
35
-
36
-
37
-
38
-
39
-
40
-
41
-
42
-
43
-
44
-
45
-
46
-
47
-
48
-
49
-
50
-
51
-
52
-
53
-
54
-
55
-
56
-
57
-
58
-
59
-
60
-
61
-
62
-
63
-
64
-
65
-
66
-
67
-
68
-
69
-
70
-
71
-
72
-
73
-
74
-
75
-
 76
76 -
 77
77 -
 78
78 -
 79
79 -
 80
80 -
 81
81 -
 82
82 -
 83
83 -
 84
84 -
 85
85 -
 86
86 -
 87
87 -
 88
88 -
 89
89 -
 90
90 -
 91
91 -
 92
92 -
 93
93 -
 94
94 -
 95
95 -
 96
96 -
97
-
98
-
99
-
100
-
101
-
102
-
103
-
104
 |
 |
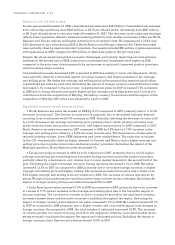
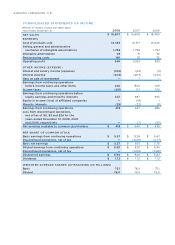
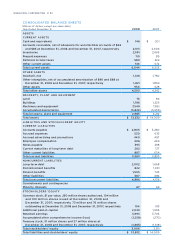
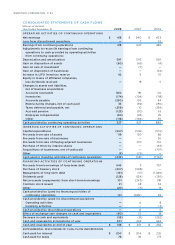
For the year ended December 31, 2008, consolidated net sales were $18.9 billion. Consolidated net earnings
from continuing operations were $418 million, or $5.50 per diluted share, decreasing from $647 million
or $8.10 per diluted share for the year ended December 31, 2007. The decrease in net sales and earnings
reflects lower appliance industry demand resulting primarily from weaker economies within our North
America and Europe regions and higher material and oil-related costs. We experienced a 10.4% and
2.0% decrease in unit sales during 2008 in North America and Europe, respectively. These decreases
were partially offset by improved product price/mix. Our results included $60 million of gains associated
with asset sales in 2008, compared to $72 million of asset sale gains in the previous year.
Despite the above mentioned global economic challenges, particularly impacting our international
business in the second half of 2008, sales from our international businesses were higher in 2008
compared to the prior year driven primarily by an increase in units sold, improved product price/mix
and favorable foreign currency.
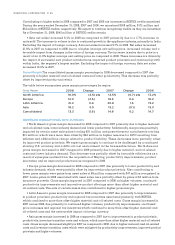
Consolidated net sales decreased 2.6% compared to 2007 due mainly to lower unit shipments, which
were partially offset by a favorable impact of foreign currency and slight increases in the average
unit selling price. We define the average unit selling price as the amount that results from dividing
consolidated net sales by units sold. Excluding the impact of foreign currency, consolidated net sales
decreased 5.1% compared to the prior year. Consolidated net sales for 2007 increased 7.3% compared
to 2006 due to strong international sales, higher global average unit selling prices and a full year’s
contribution from the acquisition of Maytag. Excluding currency fluctuations and the impact of the
acquisition of Maytag, 2007 sales were essentially equal to 2006.
• North America net sales decreased in 2008 by 8.1% compared to 2007 primarily due to a 10.4%
decrease in units sold. The decline in units sold is primarily due to decreased industry demand
resulting from a continued weak U.S. economy in 2008. Partially offsetting the decrease in units sold
is a 2.5% increase in the average unit selling price primarily due to better product price/mix, new
product introductions and product innovation, and higher market share in 2008 compared to 2007.
North America net sales increased in 2007 compared to 2006 by 0.8% due to a 7.6% increase in the
average unit selling price offset by a 6.4% decrease in units sold. The decrease in volume reflects
reduced industry volume, lower OEM shipments and lower market share. The reduction in volume
in the U.S. was partially offset by higher demand in Canada and Mexico and a higher average unit
selling price due to product innovation and better product price/mix. Excluding the impact of the
Maytag acquisition, North America sales decreased 5%.
• Europe net sales increased in 2008 by 4.4% compared to 2007, primarily due to a 6.5% higher
average unit selling price resulting from favorable foreign currency and better product price/mix,
partially offset by a decrease in unit volume due to lower market demand in the second half of the
year. Excluding the impact of foreign currency, Europe net sales decreased 3.1% in 2008. Net sales
increased 12.1% in 2007 as compared to 2006 primarily due to favorable foreign currency, a higher
average unit selling price and higher volume. The increase in sales due to price was a result of an
8.3% higher average unit selling price as compared to 2006. The increase in volume was driven by
strong Whirlpool brand performance and the positive impact of new product offerings. Excluding the
impact of foreign currency, Europe net sales increased 2.9% in 2007.
• Latin America net sales increased 7.8% in 2008 as compared to 2007, primarily due to an increase
in volume of 5.7% and an increase in the average unit selling price due to the favorable impact of
foreign currency. The increase in volume is due to continued growth in the appliance industry,
increased market share and favorable economic conditions throughout the region. Excluding the
impact of foreign currency, Latin America net sales increased 1.7% in 2008. Net sales increased 27.7%
in 2007 as compared to 2006 primarily due to higher volume and a favorable impact from changes in
foreign currency. As compared to 2006, the total number of units sold increased 18.8%. The increase
in volume growth is a result of strong growth in the appliance industry, increased market share,
strong economic conditions throughout the region and cost based pricing. Excluding the impact of
foreign currency, Latin America net sales increased 15.9% in 2007.