Vtech 2008 Annual Report Download - page 9
Download and view the complete annual report
Please find page 9 of the 2008 Vtech annual report below. You can navigate through the pages in the report by either clicking on the pages listed below, or by using the keyword search tool below to find specific information within the annual report.-
 1
1 -
 2
2 -
 3
3 -
 4
4 -
 5
5 -
 6
6 -
 7
7 -
 8
8 -
 9
9 -
 10
10 -
 11
11 -
 12
12 -
 13
13 -
 14
14 -
 15
15 -
 16
16 -
 17
17 -
 18
18 -
 19
19 -
 20
20 -
21
-
22
-
23
-
24
-
25
-
26
-
27
-
28
-
29
-
30
-
31
-
32
-
33
-
34
-
35
-
36
-
37
-
38
-
39
-
40
-
41
-
42
-
43
-
44
-
45
-
46
-
47
-
48
-
49
-
50
-
51
-
52
-
53
-
54
-
55
-
56
-
57
-
58
-
59
-
60
 |
 |

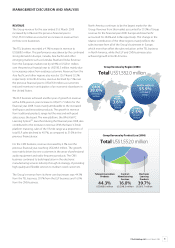
VTech Holdings Ltd Annual Report 2008 7
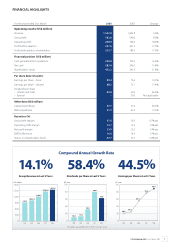
NET PROFIT AND DIVIDENDS
The pro t attributable to shareholders for the year ended
31st March 2008 was US$215.7 million, an increase of US$32.8
million as compared to the previous nancial year. The ratios of
EBIT and EBITDA to revenue were 14.7% and 16.6% respectively.
Basic earnings per share for the year ended 31st March 2008
were US89.4 cents as compared to US76.6 cents in the previous
nancial year. During the year, the Group declared and paid an
interim dividend of US12.0 cents per share, which aggregated
to US$29.1 million. The directors have proposed a nal dividend
of US51.0 cents per share, which will aggregate to US$124.2
million. The total dividend for the year amounts to US63.0 cents
per share. Excluding a special dividend of US30.0 cents per
share in the nancial year 2007, the total dividend per share
for the nancial year 2008 increases 26.0% over the previous
nancial year.
LIQUIDITY AND FINANCIAL RESOURCES
Shareholders’ funds as at 31st March 2008 were US$452.3
million, a 31.8% increase from the US$343.3 million reported for
the nancial year 2007. The net assets per share increased by
29.2% from US$1.44 to US$1.86.
As at 31st March 2008, the net cash plus currency-linked
deposits with principal protected had increased to US$300.1
million, up 21.7% from US$246.5million at the previous year-end.
The Group is substantively debt-free, except for an insigni cant
amount in the form of a xed-interest bearing equipment loan
which is denominated in Euro and repayable within one year.
TREASURY POLICIES
The objective of the Group’s treasury policies is to manage its
exposure to uctuation in foreign currency exchange rates
arising from the Group’s global operations. It is our policy not
to engage in speculative activities. Forward foreign exchange
contracts are used to hedge certain exposures.
WORKING CAPITAL
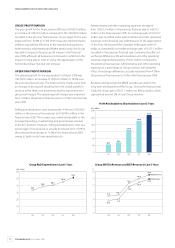
The stock balance as at 31st March 2008 increased by 6.7%
over the balance at 31st March 2007 to US$132.4 million.
The increase in stock level is primarily to meet anticipated
sales orders in the rst quarter of the nancial year 2009. The
turnover days increased from 68 days to 72 days. The trade
debtors balance as at 31st March 2008 was US$182.2 million as
compared to US$178.7 million in the previous nancial year. The
turnover days were 65 days, the same as in the previous nancial
year. The increase in trade debtors balance as at 31st March
2008 was mainly due to an increase in revenue in the fourth
quarter when compared with the corresponding period of the
previous nancial year. The increase in sales at the TEL business
in Europe also led to a higher trade debtors balance because
European customers of our ODM business tend to have a longer
settlement period.
CAPITAL EXPENDITURE
For the year ended 31st March 2008, the Group invested
US$47.1 million in the construction of buildings, purchase of
plant and machinery, equipment, computer systems and other
tangible assets. All of these capital expenditures were nanced
from internal resources.
CAPITAL COMMITMENTS AND CONTINGENCIES
The Group will incur capital expenditure of US$32.0 million
in the nancial year 2009 for ongoing business operations. In
addition, we are planning to further invest US$25.2 million to
build the third manufacturing facilities in Qingyuan, northern
Guangdong province in the next three years.
All of these capital expenditures will be nanced from
internal resources.
As of the nancial year end date, the Group had no material
contingencies.
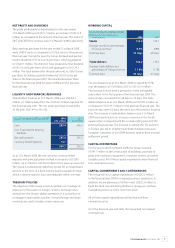
As at 31st March 2008 and 2007 2008
US$ million
2007
US$ million
Cash 285.4 246.5
Less: Total interest bearing
liabilities ––
Net cash position 285.4 246.5
Currency-linked deposits 14.7 –
300.1 246.5
As at 31st March 2008 and 2007
All gures are in US$ million unless
stated otherwise 2008 2007
Stocks 132.4 124.1
Average stocks as a percentage
of Group revenue 8.3% 8.8%
Turnover days 72 days 68 days
Trade debtors 182.2 178.7
Average trade debtors as a
percentage of Group revenue 11.6% 11.7%
Turnover days 65 days 65 days