Vtech 2008 Annual Report Download - page 3
Download and view the complete annual report
Please find page 3 of the 2008 Vtech annual report below. You can navigate through the pages in the report by either clicking on the pages listed below, or by using the keyword search tool below to find specific information within the annual report.-
 1
1 -
 2
2 -
 3
3 -
 4
4 -
 5
5 -
 6
6 -
 7
7 -
 8
8 -
 9
9 -
 10
10 -
 11
11 -
 12
12 -
 13
13 -
 14
14 -
15
-
16
-
17
-
18
-
19
-
20
-
21
-
22
-
23
-
24
-
25
-
26
-
27
-
28
-
29
-
30
-
31
-
32
-
33
-
34
-
35
-
36
-
37
-
38
-
39
-
40
-
41
-
42
-
43
-
44
-
45
-
46
-
47
-
48
-
49
-
50
-
51
-
52
-
53
-
54
-
55
-
56
-
57
-
58
-
59
-
60
 |
 |

VTech Holdings Ltd Annual Report 2008 1
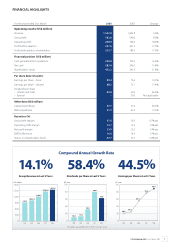
FINANCIAL HIGHLIGHTS
For the year ended 31st March 2008 2007 Change
Operating results (US$ million)
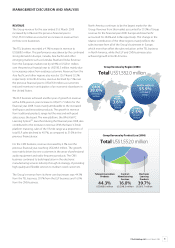
Revenue 1,552.0 1,463.8 6.0%
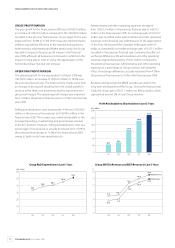
Gross pro t 583.0 540.0 8.0%
Operating pro t 228.9 194.0 18.0%
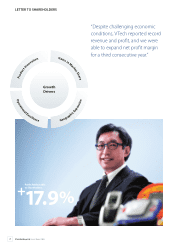
Pro t before taxation 237.6 201.5 17.9%
Pro t attributable to shareholders 215.7 182.9 17.9%
Financial position (US$ million)
Cash generated from operations 228.8 196.9 16.2%
Net cash 285.4 246.5 15.8%
Shareholders’ funds 452.3 343.3 31.8%
Per share data (US cents)
Earnings per share – basic 89.4 76.6 16.7%
Earnings per share – diluted 88.2 75.1 17.4%
Dividends per share
– Interim and Final
– Special
63.0
–
50.0
30.0
26.0%
Not applicable
Other data (US$ million)
Capital expenditure 47.1 37.2 26.6%
R&D expenditure 51.3 45.2 13.5%
Key ratios (%)
Gross pro t margin 37.6 36.9 0.7% pts
Operating pro t margin 14.7 13.3 1.4% pts
Net pro t margin 13.9 12.5 1.4% pts
EBITDA/Revenue 16.6 14.9 1.7% pts
Return on shareholders’ funds 47.7 53.3 -5.6% pts
Group Revenue in Last 5 Years Earnings per Share in Last 5 YearsDividends per Share in Last 5 Years
14.1%
Compound Annual Growth Rate
58.4% 44.5%