Vtech 2008 Annual Report Download - page 8
Download and view the complete annual report
Please find page 8 of the 2008 Vtech annual report below. You can navigate through the pages in the report by either clicking on the pages listed below, or by using the keyword search tool below to find specific information within the annual report.-
 1
1 -
 2
2 -
 3
3 -
 4
4 -
 5
5 -
 6
6 -
 7
7 -
 8
8 -
 9
9 -
 10
10 -
 11
11 -
 12
12 -
 13
13 -
 14
14 -
 15
15 -
 16
16 -
 17
17 -
 18
18 -
 19
19 -
20
-
21
-
22
-
23
-
24
-
25
-
26
-
27
-
28
-
29
-
30
-
31
-
32
-
33
-
34
-
35
-
36
-
37
-
38
-
39
-
40
-
41
-
42
-
43
-
44
-
45
-
46
-
47
-
48
-
49
-
50
-
51
-
52
-
53
-
54
-
55
-
56
-
57
-
58
-
59
-
60
 |
 |

VTech Holdings Ltd Annual Report 2008
6
MANAGEMENT DISCUSSION AND ANALYSIS
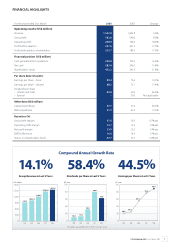
GROSS PROFIT/MARGIN
The gross pro t for the nancial year 2008 was US$583.0 million,
an increase of US$43.0 million compared to the US$540.0 million
recorded in the previous nancial year. Gross margin for the year
improved from 36.9% to 37.6%. With measures implemented to
enhance operational e ciency in the manufacturing process,
better product engineering and higher productivity, the Group
was able to improve the gross pro t margin in the nancial
year 2008, although all businesses continued to su er from the
impact of rising labour costs in China, the appreciation of the
Renminbi and raw material cost increase.
OPERATING PROFIT/MARGIN
The operating pro t for the year ended 31st March 2008 was
US$228.9 million, an increase of US$34.9 million or 18.0% over
the previous nancial year. The improvement mainly came from
an increase in gross pro t resulting from the overall growth in
revenue at the three core businesses and the improvement in
gross pro t margin. The operating pro t margin also improved
from 13.3% in the previous nancial year to 14.7% in the nancial
year 2008.
Selling and distribution costs increased by 4.1% from US$238.6
million in the previous nancial year to US$248.5 million in the
nancial year 2008. The increase was mainly attributable to the
increased spending on advertising and promotional activities
at the ELP business. However, selling and distribution costs as a
percentage of Group revenue actually decreased from 16.3% in
the previous nancial year to 16.0% in the nancial year 2008,
owing to tight control over operating costs.
Administrative and other operating expenses decreased
from US$62.2 million in the previous nancial year to US$54.3
million in the nancial year 2008. An exchange gain of US$10.7
million was recorded under administrative and other operating
expenses in the nancial year 2008 because of the appreciation
of the Euro, Sterling and the Canadian dollar against the US
dollar, as compared to a smaller exchange gain of US$3.1 million
recorded in the previous nancial year. Excluding the e ect of
exchange di erences, the administrative and other operating
expenses slightly decreased by US$0.3 million compared to
the previous nancial year. Administrative and other operating
expenses as a percentage of Group revenue, excluding the
e ect of exchange di erences, actually improved from 4.5% in
the previous nancial year to 4.2% in the nancial year 2008.
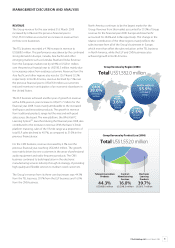
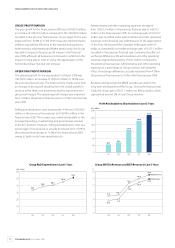
Research and development (R&D) activities are vital for the
long-term development of the Group. During the nancial year
2008, the Group spent US$51.3 million on R&D activities, which
represented around 3% of total Group revenue.
Group R&D Expenditure in Last 5 Years
Pro t Attributable to Shareholders in Last 5 Years
Group EBITDA/Revenue and EBIT/Revenue in Last 5 Years