Visa 2015 Annual Report Download - page 2
Download and view the complete annual report
Please find page 2 of the 2015 Visa annual report below. You can navigate through the pages in the report by either clicking on the pages listed below, or by using the keyword search tool below to find specific information within the annual report.-
 1
1 -
 2
2 -
 3
3 -
 4
4 -
 5
5 -
 6
6 -
 7
7 -
 8
8 -
 9
9 -
 10
10 -
 11
11 -
 12
12 -
 13
13 -
14
-
15
-
16
-
17
-
18
-
19
-
20
-
21
-
22
-
23
-
24
-
25
-
26
-
27
-
28
-
29
-
30
-
31
-
32
-
33
-
34
-
35
-
36
-
37
-
38
-
39
-
40
-
41
-
42
-
43
-
44
-
45
-
46
-
47
-
48
-
49
-
50
-
51
-
52
-
53
-
54
-
55
-
56
-
57
-
58
-
59
-
60
-
61
-
62
-
63
-
64
-
65
-
66
-
67
-
68
-
69
-
70
-
71
-
72
-
73
-
74
-
75
-
76
-
77
-
78
-
79
-
80
-
81
-
82
-
83
-
84
-
85
-
86
-
87
-
88
-
89
-
90
-
91
-
92
-
93
-
94
-
95
-
96
-
97
-
98
-
99
-
100
-
101
-
102
-
103
-
104
-
105
-
106
-
107
-
108
-
109
-
110
-
111
-
112
-
113
-
114
-
115
-
116
-
117
-
118
-
119
-
120
-
121
-
122
-
123
-
124
-
125
-
126
-
127
-
128
-
129
-
130
-
131
-
132
-
133
-
134
-
135
-
136
-
137
-
138
-
139
-
140
-
141
-
142
-
143
-
144
-
145
-
146
-
147
-
148
-
149
-
150
-
151
-
152
-
153
-
154
-
155
-
156
-
157
-
158
-
159
-
160
-
161
-
162
-
163
 |
 |

$400
$350
$300
$250
$200
$150
$100
9/30/10 9/30/11 9/30/12 9/30/13 9/30/1
5
9/30/14
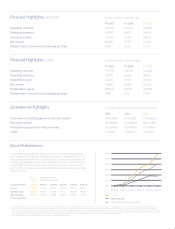
Financial Highlights ADJUSTED1In millions (except for per share data)
FY 2013 FY 2014 FY 2015
Operating revenues $11,778 $12,702 $13,880
Operating expenses $4,539 $4,555 $4,816
Operating income $7,239 $8,147 $9,064
Net income $4,980 $5,721 $6,438
Diluted class A common stock earnings per share $1.90 $2.27 $2.62
Financial Highlights GAAP In millions (except for per share data)
FY 2013 FY 2014 FY 2015
Operating revenues $11,778 $12,702 $13,880
Operating expenses $4,539 $5,005 $4,816
Operating income $7,239 $7,697 $9,064
Net income $4,980 $5,438 $6,328
Stockholders' equity $26,870 $27,413 $29,842
Diluted class A common stock earnings per share $1.90 $2.16 $2.58
Stock Performance
The accompanying graph and chart compares the cumulative total return on
Visa’s common stock with the cumulative total return on Standard & Poor’s 500
Index and the Standard & Poor’s 500 Data Processing Index from September 30,
2010 through September 30, 2015. The comparison assumes $100 was invested
on September 30, 2010, and that dividends were reinvested. Visa Inc.’s class B
and C common stock are not publicly traded or listed on any exchange or dealer
quotation system.
Visa Inc.
S&P 500 Index
S&P 500 Data Processing Index
Operational Highlights 12 months ended September 30 (except where noted)
2013 2014 2015
Total volume, including payments and cash volume2$6.9 trillion $7.3 trillion $7.4 trillion
Payments volume2$4.3 trillion $4.7 trillion $4.9 trillion
Transactions processed on Visa's networks 58.5 billion 65.0 billion 71.0 billion
Cards32.1 billion 2.3 billion 2.4 billion
Base
period
Indexed Returns
(Fiscal Year Ended)
Company/Index 9/30/10 9/30/11 9/30/12 9/30/13 9/30/14 9/30/15
Visa Inc. 100.00 116.32 183.63 263.44 296.35 389.74
S&P 500 Index 100.00 101.15 131.69 157.17 188.18 187.02
S&P 500 Data
Processing Index
100.00 110.45 156.84 219.03 249.56 297.45
1For further discussion of fiscal years 2015 and 2014 non-GAAP adjusted operating expenses, operating income, net income and diluted earnings per share, see Item 7 - Management’s Discussion and Analysis of Financial Condition and Results of
Operations - Overview - Adjusted financial results in this Annual Report. The per share amounts for the prior periods presented have been retroactively adjusted to reflect the four-for-one stock split effected in the second quarter of fiscal 2015.
2Total volume is the sum of payments volume and cash volume. Payments volume is the total monetary value of transactions for goods and services that are purchased on Visa-branded cards and payment products. Cash volume generally consists of
cash access transactions, balance access transactions, balance transfers and convenience checks. Payments volume for the 12 months ended June 30 is the basis for service revenue for the 12 months ended September 30. For further discussion, see
Item 7 - Management’s Discussion and Analysis of Financial Condition and Results of Operations - Overview - Nominal payments volume and transaction counts in this Annual Report.
3These figures represent data for the quarters ended June 30, 2015, June 30, 2014 and June 30, 2013.