United Healthcare 2005 Annual Report Download - page 29
Download and view the complete annual report
Please find page 29 of the 2005 United Healthcare annual report below. You can navigate through the pages in the report by either clicking on the pages listed below, or by using the keyword search tool below to find specific information within the annual report.-
 1
1 -
2
-
3
-
4
-
5
-
6
-
7
-
8
-
9
-
10
-
11
-
12
-
13
-
14
-
15
-
16
-
17
-
18
-
 19
19 -
 20
20 -
 21
21 -
 22
22 -
 23
23 -
 24
24 -
 25
25 -
 26
26 -
 27
27 -
 28
28 -
 29
29 -
 30
30 -
 31
31 -
 32
32 -
 33
33 -
 34
34 -
 35
35 -
 36
36 -
 37
37 -
 38
38 -
 39
39 -
40
-
41
-
42
-
43
-
44
-
45
-
46
-
47
-
48
-
49
-
50
-
51
-
52
-
53
-
54
-
55
-
56
-
57
-
58
-
59
-
60
-
61
-
62
-
63
-
64
-
65
-
66
-
67
-
68
-
69
-
70
-
71
-
72
-
73
-
74
-
75
-
76
-
77
-
78
-
79
-
80
-
81
-
82
-
83
 |
 |
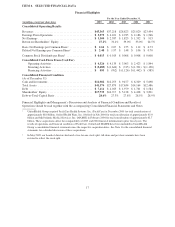
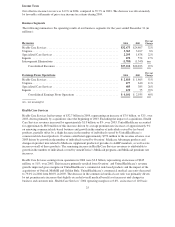
Earnings from operations in 2004 of $485 million increased $100 million, or 26%, over 2003. Specialized Care
Services’ operating margin increased to 21.1% in 2004, up from 20.5% in 2003. This increase was driven
primarily by operational and productivity improvements within Specialized Care Services’ businesses and
consolidation of the production and service operation infrastructure to enhance productivity and efficiency and to
improve the quality and consistency of service, partially offset by a business mix shift toward higher revenue,
lower margin products.
Ingenix
Ingenix revenues in 2004 of $670 million increased by $96 million, or 17%, over 2003. This was driven
primarily by new business growth in the health information and contract research businesses. Earnings from
operations in 2004 were $129 million, up $54 million, or 72%, from 2003. Operating margin was 19.3% in 2004,
up from 13.1% in 2003. The increase in earnings from operations and operating margin was primarily due to
growth and improving gross margins in the health information and clinical research businesses.
Financial Condition, Liquidity and Capital Resources at December 31, 2005
Liquidity and Capital Resources
We manage our cash, investments and capital structure so we are able to meet the short- and long-term
obligations of our business while maintaining strong financial flexibility and liquidity. We forecast, analyze and
monitor our cash flows to enable prudent investment management and financing within the confines of our
financial strategy.
Our regulated subsidiaries generate significant cash flows from operations. A majority of the assets held by our
regulated subsidiaries are in the form of cash, cash equivalents and investments. After considering expected cash
flows from operating activities, we generally invest cash of regulated subsidiaries that exceed our short-term
obligations in longer term, investment-grade, marketable debt securities to improve our overall investment return.
Factors we consider in making these investment decisions include our board of directors’ approved investment
policy, regulatory limitations, return objectives, tax implications, risk tolerance and maturity dates. Our long-
term investments are also available for sale to meet short-term liquidity and other needs. Cash in excess of the
capital needs of our regulated entities are paid to their non-regulated parent companies, typically in the form of
dividends, for general corporate use, when and as permitted by applicable regulations.
Our non-regulated businesses also generate significant cash from operations for general corporate use. Cash
flows generated by these entities, combined with the issuance of commercial paper, long-term debt and the
availability of committed credit facilities, further strengthen our operating and financial flexibility. We generally
use these cash flows to reinvest in our businesses in the form of capital expenditures, to expand the depth and
breadth of our services through business acquisitions, and to repurchase shares of our common stock, depending
on market conditions.
Cash flows generated from operating activities, our primary source of liquidity, are principally from net earnings,
prior to depreciation and amortization. As a result, any future decline in our profitability may have a negative
impact on our liquidity. The level of profitability of our risk-based insured business depends in large part on our
ability to accurately predict and price for health care and operating cost increases. This risk is partially mitigated
by the diversity of our other businesses, the geographic diversity of our risk-based business and our disciplined
underwriting and pricing processes, which seek to match premium rate increases with future health care costs. In
2005, a hypothetical unexpected 1% increase in commercial insured medical costs would have reduced net
earnings by approximately $130 million.
The availability of financing in the form of debt or equity is influenced by many factors, including our
profitability, operating cash flows, debt levels, debt ratings, debt covenants and other contractual restrictions,
regulatory requirements and market conditions. We believe that our strategies and actions toward maintaining
financial flexibility mitigate much of this risk.
27