Unilever 2004 Annual Report Download - page 9
Download and view the complete annual report
Please find page 9 of the 2004 Unilever annual report below. You can navigate through the pages in the report by either clicking on the pages listed below, or by using the keyword search tool below to find specific information within the annual report.-
 1
1 -
 2
2 -
 3
3 -
 4
4 -
 5
5 -
 6
6 -
 7
7 -
 8
8 -
 9
9 -
 10
10 -
 11
11 -
 12
12 -
 13
13 -
 14
14 -
 15
15 -
 16
16 -
 17
17 -
 18
18 -
 19
19 -
 20
20 -
21
-
22
-
23
-
24
-
25
-
26
-
27
-
28
-
29
-
30
-
31
-
32
-
33
-
34
-
35
-
36
-
37
-
38
-
39
-
40
-
41
-
42
-
43
-
44
-
45
-
46
-
47
-
48
-
49
-
50
-
51
-
52
-
53
-
54
-
55
-
56
-
57
-
58
-
59
-
60
-
61
-
62
-
63
-
64
-
65
-
66
-
67
-
68
-
69
-
70
-
71
-
72
-
73
-
74
-
75
-
76
-
77
-
78
-
79
-
80
-
81
-
82
-
83
-
84
-
85
-
86
-
87
-
88
-
89
-
90
-
91
-
92
-
93
-
94
-
95
-
96
-
97
-
98
-
99
-
100
-
101
-
102
-
103
-
104
-
105
-
106
-
107
-
108
-
109
-
110
-
111
-
112
-
113
-
114
-
115
-
116
-
117
-
118
-
119
-
120
-
121
-
122
-
123
-
124
-
125
-
126
-
127
-
128
-
129
-
130
-
131
-
132
-
133
-
134
-
135
-
136
-
137
-
138
-
139
-
140
-
141
-
142
-
143
-
144
-
145
-
146
-
147
-
148
-
149
-
150
-
151
-
152
-
153
-
154
-
155
-
156
-
157
-
158
-
159
-
160
-
161
-
162
-
163
-
164
-
165
-
166
-
167
-
168
-
169
-
170
-
171
-
172
-
173
-
174
-
175
-
176
-
177
-
178
-
179
-
180
-
181
-
182
-
183
-
184
-
185
-
186
-
187
-
188
-
189
-
190
-
191
-
192
 |
 |

06 Unilever Annual Report and Accounts 2004
Key performance measures (continued)
(including reconciliation to GAAP measures)
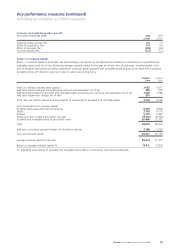
Ungeared free cash flow
Ungeared free cash flow is cash flow from group operating activities, less capital expenditure and financial investment and less a tax
charge adjusted to reflect an ungeared position, all expressed at current exchange rates.
€ million € million € million
2004 2003 2002
Cash flow from group operating activities 6 853 6 780 7 883
Less capital expenditure and financial investment (1 044) (1 024) (1 706)
Less tax charge adjusted to reflect an ungeared position:(b) (953) (1 817) (1 967)
Taxation on profit on ordinary activities (782) (1 527) (1 605)
Tax relief on interest and other finance income/(cost)
(excluding tax relief relating to interest on pensions and similar obligations) (171) (290) (362)
Ungeared free cash flow 4 856 3 939 4 210
(b) The 2004 adjusted tax charge reflects a low rate of tax as a result of non-cash charges taken in the fourth quarter including the
Slim•Fast goodwill impairment charge and other exceptional items. Ungeared free cash flow based on actual cash tax paid would
be €4.2 billion, a level which is more representative of the underlying trend.
Return on invested capital and ungeared free cash flow are presented as we believe that these ratios are the best indicators of our
approach to value creation.
Adjusted EBITDA interest cover
Unilever uses an adjusted EBITDA net interest cover as one of its key measures for the management of its Treasury strategy. For this
purpose adjusted EBITDA is defined as: earnings on ordinary activities excluding associates and non-cash share option costs before net
interest on net debt, taxation, depreciation, amortisation and impairment divided by net interest on net debt excluding associates. Details
of the calculation of adjusted EBITDA and adjusted net interest cover on adjusted EBITDA are given below.
€ million € million € million
2004 2003 2002
Profit on ordinary activities before taxation 2 839 4 538 4 053
Add back share of operating profit of associates before tax 423 (7)
Add back non-cash share option costs 218 208 185
Add back net interest 582 799 1 146
Add back depreciation 996 899 1 337
Add back amortisation 1 086 1 143 1 261
Add back impairment 777 ––
Adjusted EBITDA 6 502 7 610 7 975
Net interest 628 847 1 173
Less interest of associates (46) (48) (27)
Adjusted net interest 582 799 1 146
Adjusted net interest cover based on adjusted EBITDA (times) 11.2 9.5 7.0
Effect of depreciation, amortisation, impairment and other adjustments above (times) (5.3) (2.8) (2.5)
Net interest cover (times) 5.9 6.7 4.5