Unilever 2004 Annual Report Download - page 7
Download and view the complete annual report
Please find page 7 of the 2004 Unilever annual report below. You can navigate through the pages in the report by either clicking on the pages listed below, or by using the keyword search tool below to find specific information within the annual report.-
 1
1 -
 2
2 -
 3
3 -
 4
4 -
 5
5 -
 6
6 -
 7
7 -
 8
8 -
 9
9 -
 10
10 -
 11
11 -
 12
12 -
 13
13 -
 14
14 -
 15
15 -
 16
16 -
 17
17 -
 18
18 -
19
-
20
-
21
-
22
-
23
-
24
-
25
-
26
-
27
-
28
-
29
-
30
-
31
-
32
-
33
-
34
-
35
-
36
-
37
-
38
-
39
-
40
-
41
-
42
-
43
-
44
-
45
-
46
-
47
-
48
-
49
-
50
-
51
-
52
-
53
-
54
-
55
-
56
-
57
-
58
-
59
-
60
-
61
-
62
-
63
-
64
-
65
-
66
-
67
-
68
-
69
-
70
-
71
-
72
-
73
-
74
-
75
-
76
-
77
-
78
-
79
-
80
-
81
-
82
-
83
-
84
-
85
-
86
-
87
-
88
-
89
-
90
-
91
-
92
-
93
-
94
-
95
-
96
-
97
-
98
-
99
-
100
-
101
-
102
-
103
-
104
-
105
-
106
-
107
-
108
-
109
-
110
-
111
-
112
-
113
-
114
-
115
-
116
-
117
-
118
-
119
-
120
-
121
-
122
-
123
-
124
-
125
-
126
-
127
-
128
-
129
-
130
-
131
-
132
-
133
-
134
-
135
-
136
-
137
-
138
-
139
-
140
-
141
-
142
-
143
-
144
-
145
-
146
-
147
-
148
-
149
-
150
-
151
-
152
-
153
-
154
-
155
-
156
-
157
-
158
-
159
-
160
-
161
-
162
-
163
-
164
-
165
-
166
-
167
-
168
-
169
-
170
-
171
-
172
-
173
-
174
-
175
-
176
-
177
-
178
-
179
-
180
-
181
-
182
-
183
-
184
-
185
-
186
-
187
-
188
-
189
-
190
-
191
-
192
 |
 |

04 Unilever Annual Report and Accounts 2004
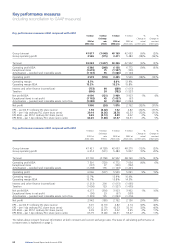
Key performance measures
(including reconciliation to GAAP measures)
Key performance measures 2004 compared with 2003
€ million € million € million € million % %
Exchange Change at Change at
2004 at rate 2004 at 2003 at actual constant
2003 rates effects 2004 rates 2003 rates current rates 2003 rates
Group turnover 41 817 (1 648) 40 169 42 693 (6)% (2)%
Group operating profit 3 526 (115) 3 411 5 483 (38)% (36)%
Turnover 42 023 (1 657) 40 366 42 942 (6)% (2)%
Operating profit BEIA 6 386 (248) 6 138 6 772 (9)% (6)%
Exceptional items (1 672) 75 (1 597) (100)
Amortisation – goodwill and intangible assets (1 141) 55 (1 086) (1 143)
Operating profit 3 573 (118) 3 455 5 529 (38)% (35)%
Operating margin 8.5% 8.6% 12.9%
Operating margin BEIA 15.2% 15.2% 15.8%
Interest and other finance income/(cost) (753) 64 (689) (1 013)
Taxation (806) 24 (782) (1 527)
Net profit BEIA 4 090 (121) 3 969 3 923 1% 4%
Exceptional items in net profit (1 102) 45 (1 057) (67)
Amortisation – goodwill and intangible assets net of tax (1 088) 52 (1 036) (1 094)
Net profit 1 900 (24) 1 876 2 762 (32)% (31)%
EPS – per €0.51 ordinary NV share (euros) 1.94 (0.02) 1.92 2.82 (32)% (31)%
EPS – per 1.4p ordinary PLC share (euro cents) 29.14 (0.36) 28.78 42.33 (32)% (31)%
EPS BEIA – per €0.51 ordinary NV share (euros) 4.22 (0.13) 4.09 4.02 2% 5%
EPS BEIA – per 1.4p ordinary PLC share (euro cents) 63.25 (1.88) 61.37 60.31 2% 5%
Key performance measures 2003 compared with 2002
€ million € million € million € million % %
Exchange Change at Change at
2003 at rate 2003 at 2002 at actual constant
2002 rates effects 2003 rates 2002 rates current rates 2002 rates
Group turnover 47 421 (4 728) 42 693 48 270 (12)% (2)%
Group operating profit 6 014 (531) 5 483 5 007 10% 20%
Turnover 47 700 (4 758) 42 942 48 760 (12)% (2)%
Operating profit BEIA 7 501 (729) 6 772 7 054 (4)% 6%
Exceptional items (137) 37 (100) (702)
Amortisation – goodwill and intangible assets (1 298) 155 (1 143) (1 261)
Operating profit 6 066 (537) 5 529 5 091 9% 19%
Operating margin 12.7% 12.9% 10.4%
Operating margin BEIA 15.7% 15.8% 14.5%
Interest and other finance income/(cost) (1 213) 200 (1 013) (1 065)
Taxation (1 656) 129 (1 527) (1 605)
Net profit BEIA 4 277 (354) 3 923 3 902 1% 10%
Exceptional items in net profit (96) 29 (67) (550)
Amortisation – goodwill and intangible assets net of tax (1 239) 145 (1 094) (1 216)
Net profit 2 942 (180) 2 762 2 136 29% 38%
EPS – per €0.51 ordinary NV share (euros) 3.01 (0.19) 2.82 2.14 32% 40%
EPS – per 1.4p ordinary PLC share (euro cents) 45.12 (2.79) 42.33 32.16 32% 40%
EPS BEIA – per €0.51 ordinary NV share (euros) 4.39 (0.37) 4.02 3.95 2% 11%
EPS BEIA – per 1.4p ordinary PLC share (euro cents) 65.79 (5.48) 60.31 59.27 2% 11%
The tables above present financial information at both constant and current exchange rates. The basis of calculating performance at
constant rates is explained on page 2.