Ubisoft 2005 Annual Report Download - page 10
Download and view the complete annual report
Please find page 10 of the 2005 Ubisoft annual report below. You can navigate through the pages in the report by either clicking on the pages listed below, or by using the keyword search tool below to find specific information within the annual report.-
 1
1 -
 2
2 -
 3
3 -
 4
4 -
 5
5 -
 6
6 -
 7
7 -
 8
8 -
 9
9 -
 10
10 -
 11
11 -
 12
12 -
 13
13 -
 14
14 -
 15
15 -
 16
16 -
 17
17 -
 18
18 -
 19
19 -
 20
20 -
 21
21 -
22
-
23
-
24
-
25
-
26
-
27
-
28
-
29
-
30
-
31
-
32
-
33
-
34
-
35
-
36
-
37
-
38
-
39
-
40
-
41
-
42
-
43
-
44
-
45
-
46
-
47
-
48
-
49
-
50
-
51
-
52
-
53
-
54
-
55
-
56
-
57
-
58
-
59
-
60
-
61
-
62
-
63
-
64
-
65
-
66
-
67
-
68
-
69
-
70
-
71
-
72
-
73
-
74
-
75
-
76
-
77
-
78
-
79
-
80
-
81
-
82
-
83
-
84
-
85
-
86
-
87
-
88
-
89
-
90
-
91
-
92
-
93
-
94
-
95
-
96
-
97
-
98
-
99
-
100
-
101
-
102
-
103
-
104
-
105
-
106
-
107
-
108
-
109
-
110
-
111
-
112
-
113
-
114
-
115
-
116
-
117
-
118
-
119
-
120
-
121
-
122
-
123
-
124
-
125
-
126
-
127
-
128
-
129
-
130
-
131
-
132
-
133
-
134
-
135
-
136
-
137
-
138
-
139
-
140
-
141
-
142
-
143
-
144
-
145
-
146
-
147
-
148
-
149
-
150
-
151
-
152
-
153
-
154
-
155
-
156
-
157
-
158
-
159
-
160
-
161
-
162
-
163
 |
 |

(1) Before stock based compensation.
(2) €538 million in FGaap.
(3) FGaap.
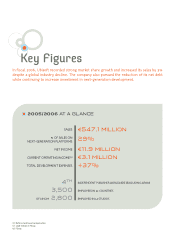
Key Figures
In fiscal 2006, Ubisoft recorded strong market share growth and increased its sales by 3%
despite a global industry decline. The company also pursued the reduction of its net debt
while continuing to increase investment in next-generation development.
4th
3,500
2,800
INDEPENDENT PUBLISHER WORLDWIDE (EXCLUDING JAPAN)
EMPLOYEES IN 22 COUNTRIES
EMPLOYED IN 14 STUDIOS
OF WHOM
SALES
% OF SALES ON
NEXT-GENERATION PLATFORMS
NET INCOME
CURRENT OPERATING INCOME(1)
TOTAL DEVELOPMENT EXPENSES
€547.1 million
29%
€11.9 million
€3.1 million
+37%
2005/2006 AT A GLANCE