TomTom 2010 Annual Report Download - page 60
Download and view the complete annual report
Please find page 60 of the 2010 TomTom annual report below. You can navigate through the pages in the report by either clicking on the pages listed below, or by using the keyword search tool below to find specific information within the annual report.-
 1
1 -
2
-
3
-
4
-
5
-
6
-
7
-
8
-
9
-
10
-
11
-
12
-
13
-
14
-
15
-
16
-
17
-
18
-
19
-
20
-
21
-
22
-
23
-
24
-
25
-
26
-
27
-
28
-
29
-
30
-
31
-
32
-
33
-
34
-
35
-
36
-
37
-
38
-
39
-
40
-
41
-
42
-
43
-
44
-
45
-
46
-
47
-
48
-
49
-
 50
50 -
 51
51 -
 52
52 -
 53
53 -
 54
54 -
 55
55 -
 56
56 -
 57
57 -
 58
58 -
 59
59 -
 60
60 -
 61
61 -
 62
62 -
 63
63 -
 64
64 -
 65
65 -
 66
66 -
 67
67 -
 68
68 -
 69
69 -
 70
70 -
71
-
72
-
73
-
74
-
75
-
76
-
77
-
78
-
79
-
80
-
81
-
82
-
83
-
84
-
85
-
86
-
87
-
88
-
89
-
90
-
91
-
92
-
93
-
94
-
95
-
96
-
97
-
98
-
99
-
100
 |
 |

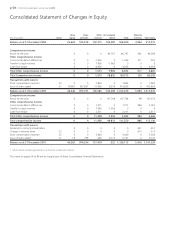
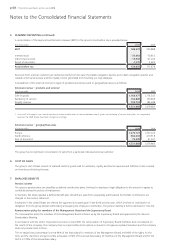
p 58 / TomTom Annual Report and Accounts 2010
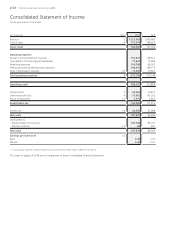
Share Share Other Accumulated Minority
(€ in thousands) Notes capital premium reserves1 deficit Total interests Total equity
Balance as at 31 December 2008 24,663 575,918 102,215 -194,387 508,409 4,964 513,373
Comprehensive income
Result for the year 0 0 0 86,767 86,767 -381 86,386
Other comprehensive income
Currency translation differences 0 0 -1,436 0 -1,436 511 -925
Transfer to legal reserves 0 0 7,965 -7,965 0 0 0
Cash flow hedge 0 0 -4,956 0 -4,956 0 -4,956
Total Other comprehensive income 0 0 1,573 -7,965 -6,392 511 -5,881
Total Comprehensive income 0 0 1,573 78,802 80,375 130 80,505
Transactions with owners
Stock compensation expense 22 0 0 7,863 0 7,863 0 7,863
Issue of share capital 21 19,681 397,837 -11,065 9,376 415,829 0 415,829
Balance as at 31 December 2009 44,344 973,755 100,586 -106,209 1,012,476 5,094 1,017,570
Comprehensive income
Result for the year 0 0 0 107,768 107,768 -98 107,670
Other comprehensive income
Currency translation differences 0 0 1,071 0 1,071 984 2,055
Transfer to legal reserves 0 0 7,956 -7,956 0 0 0
Cash flow hedge 0 0 2,411 0 2,411 0 2,411
Total Other comprehensive income 0 0 11,438 -7,956 3,482 984 4,466
Total comprehensive income 0 0 11,438 99,812 111,250 886 112,136
Transactions with owners
Dividends to minority shareholders 0 0 0 0 0 -251 -251
Change in minority share 23 0 0 0 0 0 -313 -313
Stock compensation expense 22 0 0 5,640 0 5,640 0 5,640
Issue of share capital 21 18 799 -245 6,175 6,747 0 6,747
Balance as at 31 December 2010 44,362 974,554 117,419 -222 1,136,113 5,416 1,141,529
1 Other reserves include Legal reserves and the Stock compensation reserve.
The notes on pages 59 to 86 are an integral part of these Consolidated Financial Statements.
Consolidated Statement of Changes in Equity