TomTom 2010 Annual Report Download - page 25
Download and view the complete annual report
Please find page 25 of the 2010 TomTom annual report below. You can navigate through the pages in the report by either clicking on the pages listed below, or by using the keyword search tool below to find specific information within the annual report.-
 1
1 -
2
-
3
-
4
-
5
-
6
-
7
-
8
-
9
-
10
-
11
-
12
-
13
-
14
-
 15
15 -
 16
16 -
 17
17 -
 18
18 -
 19
19 -
 20
20 -
 21
21 -
 22
22 -
 23
23 -
 24
24 -
 25
25 -
 26
26 -
 27
27 -
 28
28 -
 29
29 -
 30
30 -
 31
31 -
 32
32 -
 33
33 -
 34
34 -
 35
35 -
36
-
37
-
38
-
39
-
40
-
41
-
42
-
43
-
44
-
45
-
46
-
47
-
48
-
49
-
50
-
51
-
52
-
53
-
54
-
55
-
56
-
57
-
58
-
59
-
60
-
61
-
62
-
63
-
64
-
65
-
66
-
67
-
68
-
69
-
70
-
71
-
72
-
73
-
74
-
75
-
76
-
77
-
78
-
79
-
80
-
81
-
82
-
83
-
84
-
85
-
86
-
87
-
88
-
89
-
90
-
91
-
92
-
93
-
94
-
95
-
96
-
97
-
98
-
99
-
100
 |
 |

p 23 / TomTom Annual Report and Accounts 2010
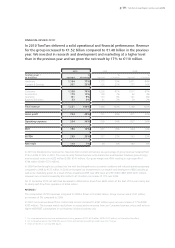
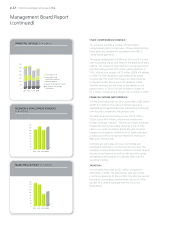
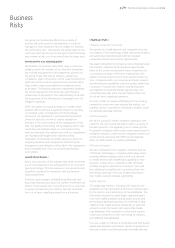
NET RESULT /
The result for 2010 was €110 million, €16 million higher
than in 2009 (€94 million). This is mainly the result of the
higher gross profit and decreased borrowing costs and
lower losses on our derivative portfolio partly offset by the
increase in operating expenses.
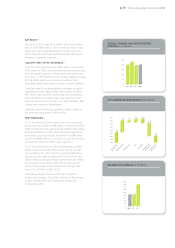
LIQUIDITY AND CAPITAL RESOURCES /
Cash flow from operations was €265 million compared to
€430 million in 2009. Cash generated by operations results
from the operating profit of €186 million adjusted for non
cash items. In 2010 investment in working capital increased
by €26 million due to an increase in inventories and
receivables partly offset by an increase in current liabilities.
Cash flow used in investing activities consisted of capital
expenditure of €65 million (2009: €90 million), of which
€47 million was invested in technology and development
and €18 million on property, plant and equipment. Our
main investments in 2010 were in our map database, data
centres and navigation technologies.
Cash flow used in financing activities is mainly related to
the term loan repayment of €210 million.
DEBT FINANCING /
On 31 December 2010 the book value of the company’s
borrowings amounted to €588 million, a decrease of €202
million compared to the previous year (2009: €790 million).
Excluding transaction costs, which are netted against the
borrowings, gross borrowings amounted to €598 million,
down from €808 million in the previous year. The decrease
resulted from the €210 million debt repayment.
On 31 December 2010 net debt had decreased to €294
million, down from €442 million at the start of the year.
The net debt is the sum of the borrowings (€598 million),
less the cash and cash equivalents at the end of the year
(€306 million) plus financial lease commitments (€1 million).
The reduction in net debt results from another year of
strong cash generation. We reduced our leverage ratio
from 1.31 in 2009 to 0.98 in 2010.
The floating interest coupon of the loan is based on
Euribor plus a margin. The Euribor element of the interest
coupon is partly fixed with interest rate swaps until
31 December 2011.
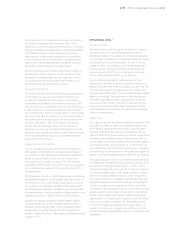
2010 CASHFLOW DEVELOPMENT (in € millions)
200
300
350
250
500
400
450
550
600
368
186 (26)
53 (65)
(210)
306
Cash position
on 31 Dec 09
Operating result
Working capital
Other
Investments
Repayment of
borrowings
Cash position
on 31 Dec 10
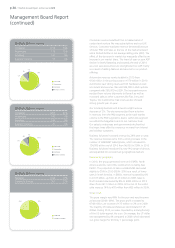
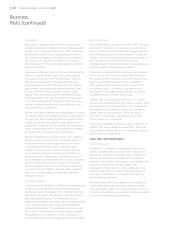
REDEMPTION SCHEDULE (in € millions)
0
150
200
50
100
300
250
350
400
450
2010 2011 2012
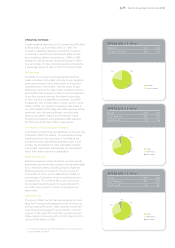
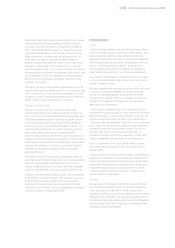
SELLING, GENERAL AND ADMINISTRATIVE
EXPENSES (in € millions)
0
150
200
50
100
250
2007 2008 2009 2010