Texas Instruments 2014 Annual Report Download - page 3
Download and view the complete annual report
Please find page 3 of the 2014 Texas Instruments annual report below. You can navigate through the pages in the report by either clicking on the pages listed below, or by using the keyword search tool below to find specific information within the annual report.-
 1
1 -
 2
2 -
 3
3 -
 4
4 -
 5
5 -
 6
6 -
 7
7 -
 8
8 -
 9
9 -
 10
10 -
 11
11 -
 12
12 -
 13
13 -
 14
14 -
15
-
16
-
17
-
18
-
19
-
20
-
21
-
22
-
23
-
24
-
25
-
26
-
27
-
28
-
29
-
30
-
31
-
32
-
33
-
34
-
35
-
36
-
37
-
38
-
39
-
40
-
41
-
42
-
43
-
44
-
45
-
46
-
47
-
48
-
49
-
50
-
51
-
52
-
53
-
54
-
55
-
56
-
57
-
58
-
59
-
60
-
61
-
62
-
63
-
64
-
65
-
66
-
67
-
68
-
69
-
70
-
71
-
72
-
73
-
74
-
75
-
76
-
77
-
78
-
79
-
80
-
81
-
82
-
83
-
84
-
85
-
86
-
87
-
88
-
89
-
90
-
91
-
92
-
93
-
94
-
95
-
96
-
97
-
98
-
99
-
100
-
101
-
102
-
103
-
104
-
105
-
106
-
107
-
108
-
109
-
110
-
111
-
112
-
113
-
114
-
115
-
116
-
117
-
118
-
119
-
120
-
121
-
122
-
123
-
124
-
125
-
126
-
127
-
128
-
129
-
130
-
131
-
132
 |
 |

TEXAS INSTRUMENTS i
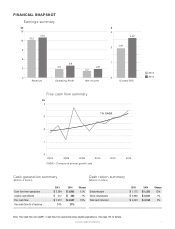
FINANCIAL SNAPSHOT
12.2
15
12
9
6
3
0
3
2
1
0
13.0
Revenue
$B $
Operating Profit Net Income Diluted EPS
2.8
3.9
2.2
1.91
2.8
2.57
Earnings summary
2013
2014
Free cash flow summary
CAGR – Compound annual growth rate
4
3
2
1
0
$B
7% CAGR
2004 2006 2008 2010 2012 2014
Cash generation summary
(Millions of dollars)
2013 2014 Change
Cash flow from operations . . . . . . $3,384 $3,892 15%
Capital expenditures . . . . . . . . . $412 $385 -7%
Free cash flow . . . . . . . . . . . . $2,972 $3,507 18%
Free cash flow % of revenue . . . . . 24% 27%
Cash return summary
(Millions of dollars)
2013 2014 Change
Dividends paid . . . . . . . . . . . . $1,175 $1,323 13%
Stock repurchases . . . . . . . . . . $2,868 $2,831 -1%
Total cash returned . . . . . . . . . . $4,043 $4,154 3%
Note: Free cash flow (non-GAAP) = Cash flow from operations minus Capital expenditures. See page 124 for details.