Texas Instruments 2006 Annual Report Download - page 11
Download and view the complete annual report
Please find page 11 of the 2006 Texas Instruments annual report below. You can navigate through the pages in the report by either clicking on the pages listed below, or by using the keyword search tool below to find specific information within the annual report.-
 1
1 -
 2
2 -
 3
3 -
 4
4 -
 5
5 -
 6
6 -
 7
7 -
 8
8 -
 9
9 -
 10
10 -
 11
11 -
 12
12 -
 13
13 -
 14
14 -
 15
15 -
 16
16 -
 17
17 -
 18
18 -
 19
19 -
 20
20 -
 21
21 -
 22
22 -
23
-
24
-
25
-
26
-
27
-
28
-
29
-
30
-
31
-
32
-
33
-
34
-
35
-
36
-
37
-
38
-
39
-
40
-
41
-
42
-
43
-
44
-
45
-
46
-
47
-
48
-
49
-
50
-
51
-
52
-
53
-
54
-
55
-
56
-
57
-
58
-
59
-
60
-
61
-
62
-
63
-
64
 |
 |

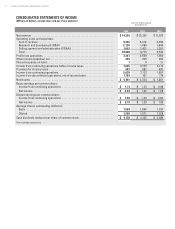
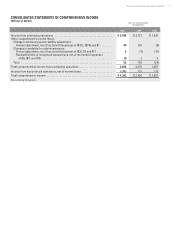
CONSOLIDATED STATEMENTS OF CASH FLOWS
(Millions of dollars)
TEXAS INSTRUMENTS 2006 ANNUAL REPORT 9
FOR THE YEARS ENDED
DECEMBER 31,
2006 2005 2004
Cash flows from operating activities:
Net income................................................................ $4,341 $2,324 $1,861
Adjustments to reconcile net income to cash provided by operating activities of
continuing operations:
Income from discontinued operations ..................................... (1,703) (151) (170)
Depreciation ............................................................ 1,052 1,346 1,449
Stock-based compensation ............................................... 332 175 18
Amortization of capitalized software ...................................... 110 126 119
Amortization of acquisition-related intangibles ............................. 59 55 69
Deferred income taxes ................................................... (200) (194) 70
Increase (decrease) from changes in:
Accounts receivable ..................................................... (116) (127) (214)
Inventories ............................................................. (248) (23) (257)
Prepaid expenses and other current assets ................................ (96) 111 155
Accounts payable and accrued expenses .................................. (104) 254 (68)
Income taxes payable .................................................... (716) 35 54
Accrued profit sharing and retirement ..................................... 28 (140) 227
Funding of retirement plans and accrued retirement costs .................... (210) (154) (202)
Other .................................................................... (76) (29) (138)
Net cash provided by operating activities of continuing operations ............... 2,453 3,608 2,973
Cash flows from investing activities:
Additions to property, plant and equipment .................................. (1,272) (1,288) (1,260)
Proceeds from sales of assets .............................................. 3,000 42 —
Purchases of cash investments ............................................. (6,821) (5,851) (3,674)
Sales and maturities of cash investments .................................... 8,418 5,430 3,809
Purchases of equity investments ............................................ (40) (17) (22)
Sales of equity and other long-term investments ............................. 11 53 32
Acquisition of businesses, net of cash acquired .............................. (205) ——
Net cash provided by (used in) investing activities of continuing operations ....... 3,091 (1,631) (1,115)
Cash flows from financing activities:
Proceeds from loans and long-term debt .................................... — 275 —
Payments on loans and long-term debt ...................................... (586) (11) (435)
Dividends paid on common stock ........................................... (199) (173) (154)
Sales and other common stock transactions ................................. 419 461 192
Excess tax benefit from stock option exercises ............................... 100 59 —
Stock repurchases ........................................................ (5,302) (4,151) (753)
Net cash used in financing activities of continuing operations.................... (5,568) (3,540) (1,150)
Cash flows from discontinued operations:
Operating activities ....................................................... 7164 173
Investing activities ........................................................ (16) (56) (46)
Net cash (used in) provided by discontinued operations ......................... (9) 108 127
Effect of exchange rate changes on cash ...................................... 2615
Net (decrease) increase in cash and cash equivalents .......................... (31) (1,449) 850
Cash and cash equivalents at beginning of year ................................ 1,214 2,663 1,813
Cash and cash equivalents at end of year ...................................... $1,183 $1,214 $2,663
See accompanying notes.