Telus 2015 Annual Report Download - page 32
Download and view the complete annual report
Please find page 32 of the 2015 Telus annual report below. You can navigate through the pages in the report by either clicking on the pages listed below, or by using the keyword search tool below to find specific information within the annual report.-
 1
1 -
2
-
3
-
4
-
5
-
6
-
7
-
8
-
9
-
10
-
11
-
12
-
13
-
14
-
15
-
16
-
17
-
18
-
19
-
20
-
21
-
 22
22 -
 23
23 -
 24
24 -
 25
25 -
 26
26 -
 27
27 -
 28
28 -
 29
29 -
 30
30 -
 31
31 -
 32
32 -
 33
33 -
 34
34 -
 35
35 -
 36
36 -
 37
37 -
 38
38 -
 39
39 -
 40
40 -
 41
41 -
 42
42 -
43
-
44
-
45
-
46
-
47
-
48
 |
 |

32
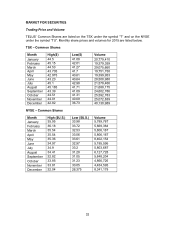
MARKET FOR SECURITIES
Trading Price and Volume
TELUS’ Common Shares are listed on the TSX under the symbol “T” and on the NYSE
under the symbol “TU”. Monthly share prices and volumes for 2015 are listed below:
TSX – Common Shares
Month
High($)
Low($)
Volume
January
44.5
41.08
20,779,410
February
45.15
42.01
19,379,359
March
44.53
41.27
29,075,660
April
43.705
41.7
19,751,758
May
42.975
40.61
19,399,953
June
43.23
40.64
28,508,988
July
45.1
42.98
21,578,466
August
45.185
41.71
21,688,175
September
43.39
41.09
24,602,786
October
44.51
41.31
25,592,783
November
44.01
40.09
25,072,839
December
42.82
36.73
40,130,989
NYSE – Common Shares
Month
High ($U.S.)
Low ($U.S.)
Volume
January
35.95
33.98
5,789,767
February
36.18
33.72
5,869,384
March
35.54
32.53
5,806,167
April
35.54
33.06
5,806,167
May
35.36
33.61
8,402,154
June
34.97
32.97
5,195,596
July
34.9
33.2
5,803,687
August
34.41
31.28
6,127,728
September
32.82
31.05
5,848,204
October
33.85
31.23
4,866,726
November
33.81
30.05
4,454,595
December
32.04
26.375
8,341,179