Telus 2009 Annual Report Download - page 19
Download and view the complete annual report
Please find page 19 of the 2009 Telus annual report below. You can navigate through the pages in the report by either clicking on the pages listed below, or by using the keyword search tool below to find specific information within the annual report.-
 1
1 -
2
-
3
-
4
-
5
-
6
-
7
-
8
-
 9
9 -
 10
10 -
 11
11 -
 12
12 -
 13
13 -
 14
14 -
 15
15 -
 16
16 -
 17
17 -
 18
18 -
 19
19 -
 20
20 -
 21
21 -
 22
22 -
 23
23 -
 24
24 -
 25
25 -
 26
26 -
 27
27 -
 28
28 -
 29
29 -
30
-
31
-
32
-
33
 |
 |

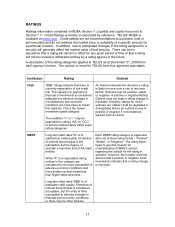
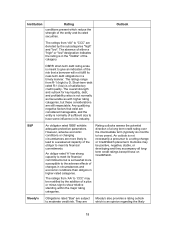
Institution Rating Outlook
considered medium-grade and as
such may possess certain
speculative characteristics.
Moody's appends numerical
modifiers 1, 2, and 3 to each generic
rating classification from ‘Aa’ through
‘Caa’. The modifier 1 indicates that
the obligation ranks in the higher
end of its generic rating category;
the modifier 2 indicates a mid-range
ranking; and the modifier 3 indicates
a ranking in the lower end of that
generic rating category.
direction of a rating over the medium term.
Where assigned, rating outlooks fall into
the following four categories: Positive
(POS), Negative (NEG), Stable (STA),
and Developing (DEV -- contingent upon
an event.
Ratings Under Review (RUR) designation
indicates that the issuer has one or more
ratings under review for possible change,
and thus overrides the outlook
designation.
MARKET FOR SECURITIES
TELUS’ Common Shares and Non-Voting Shares are listed on the Toronto Stock
Exchange (TSX) under “T” and “T.A” respectively and the TELUS Non-Voting Shares
are listed on the New York Stock Exchange under “TU”. Monthly share prices and
volumes for 2009 are listed below:
TSX – Common and Non-Voting Shares
Month Common Shares Non-Voting Shares
High($) Low($) Volume High($) Low($) Volume
January 37.50 33.17 13,580,916 35.15 31.59 7,349,642
February 35.26 31.19 13,649,159 33.31 29.32 7,452,180
March 35.95 30.63 14,724,191 34.48 29.18 9,124,553
April 36.50 29.12 21,886,587 34.99 27.69 13,755,163
May 32.57 29.12 17,976,643 31.50 27.41 11,147,646
June 33.11 30.13 16,930,861 31.78 29.00 6,794,306
July 31.95 29.68 15,957,176 30.89 28.65 6,363,854
August 34.34 30.76 14,082,829 32.85 29.66 6,399,574
September 36.05 32.29 14,894,822 34.50 31.28 7,477,701
October 34.59 32.41 12,492,810 33.38 30.42 7,003,572
November 34.99 32.78 13,454,502 33.36 30.90 5,251,146
December 35.50 31.56 19,928,371 34.08 30.51 5,607,472
19