Suzuki 2001 Annual Report Download - page 4
Download and view the complete annual report
Please find page 4 of the 2001 Suzuki annual report below. You can navigate through the pages in the report by either clicking on the pages listed below, or by using the keyword search tool below to find specific information within the annual report.-
 1
1 -
 2
2 -
 3
3 -
 4
4 -
 5
5 -
 6
6 -
 7
7 -
 8
8 -
 9
9 -
 10
10 -
 11
11 -
 12
12 -
 13
13 -
 14
14 -
 15
15 -
16
-
17
-
18
-
19
-
20
-
21
-
22
-
23
-
24
-
25
-
26
-
27
-
28
-
29
-
30
-
31
-
32
-
33
-
34
-
35
-
36
-
37
-
38
-
39
-
40
-
41
 |
 |
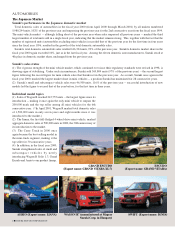
2 ●SUZUKI MOTOR CORPORATION
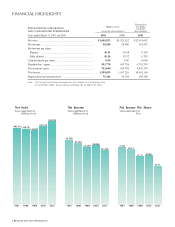
SUZUKI MOTOR CORPORATION
AND CONSOLIDATED SUBSIDIARIES
Thousands of
Millions of yen U.S. dollars
(except per
(except per share amounts) share amounts)
Years ended March 31, 2001 and 2000
2001 2000 2001
Net sales.................................................................................. ¥1,600,253 ¥1,521,192 $1$12,915,682
Net income.............................................................................. 20,248 26,886 163,427
Net income per share:
Primary ................................................................................ 40.41 55.58 0.326
Fully diluted......................................................................... 40.24 55.32 0.324
Cash dividends per share ........................................................ 8.50 8.50 0.068
Shareholders’ equity ............................................................... 593,770 497,756 4,64,792,338
Total current assets ................................................................. 723,844 628,782 5,842,170
Total assets ............................................................................. 1,299,859 1,167,216 110,491,196
Depreciation and amortization ............................................... 75,344 81,784 608,108
Note: Yen amounts have been translated into U.S. dollars, for convenience only,
at Yen123.90= US$1, the prevailing exchange rate on March 30, 2001.
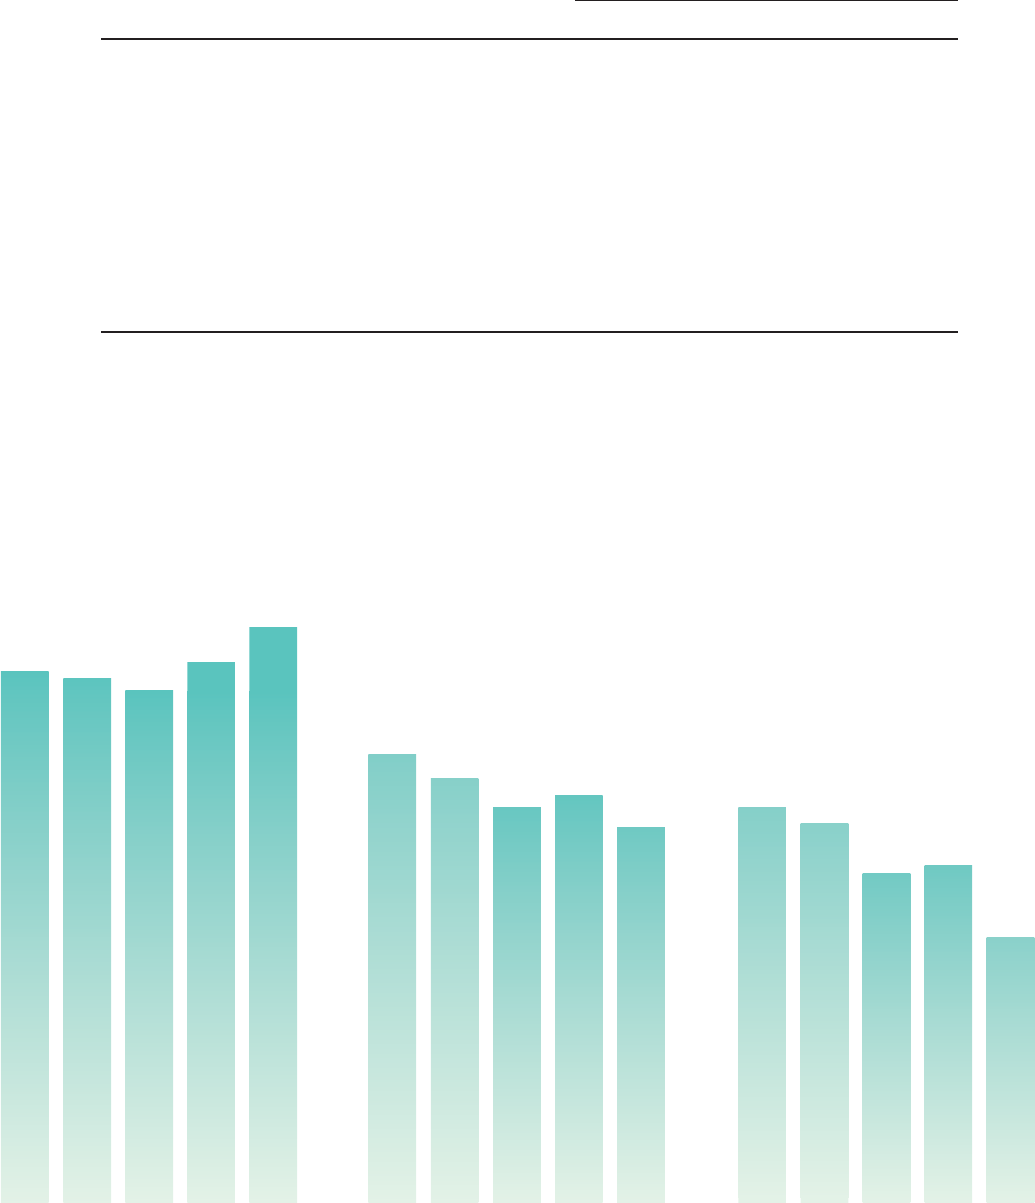
FINANCIAL HIGHLIGHTS
1999
24,359
2001
20,248
1998
30,156
1997
33,586
1999
52.72
2001
40.41
1998
67.17
1997
74.84
Years ended March 31
(Millions of yen)
Years ended March 31
(Millions of yen)
Years ended March 31
(Yen)
1999
1,455,832
2001
1,600,253
1998
1,488,785
2000
26,886
2000
55.58
2000
1,521,192
1997
1,502,424
Net Sales Net Income Net Income Per Share