Suzuki 2000 Annual Report Download - page 35
Download and view the complete annual report
Please find page 35 of the 2000 Suzuki annual report below. You can navigate through the pages in the report by either clicking on the pages listed below, or by using the keyword search tool below to find specific information within the annual report.-
 1
1 -
2
-
3
-
4
-
5
-
6
-
7
-
8
-
9
-
10
-
11
-
12
-
13
-
14
-
15
-
16
-
17
-
18
-
19
-
20
-
21
-
22
-
23
-
24
-
 25
25 -
 26
26 -
 27
27 -
 28
28 -
 29
29 -
 30
30 -
 31
31 -
 32
32 -
 33
33 -
 34
34 -
 35
35 -
 36
36 -
 37
37 -
 38
38 -
 39
39
 |
 |
Thousands of
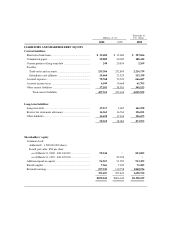
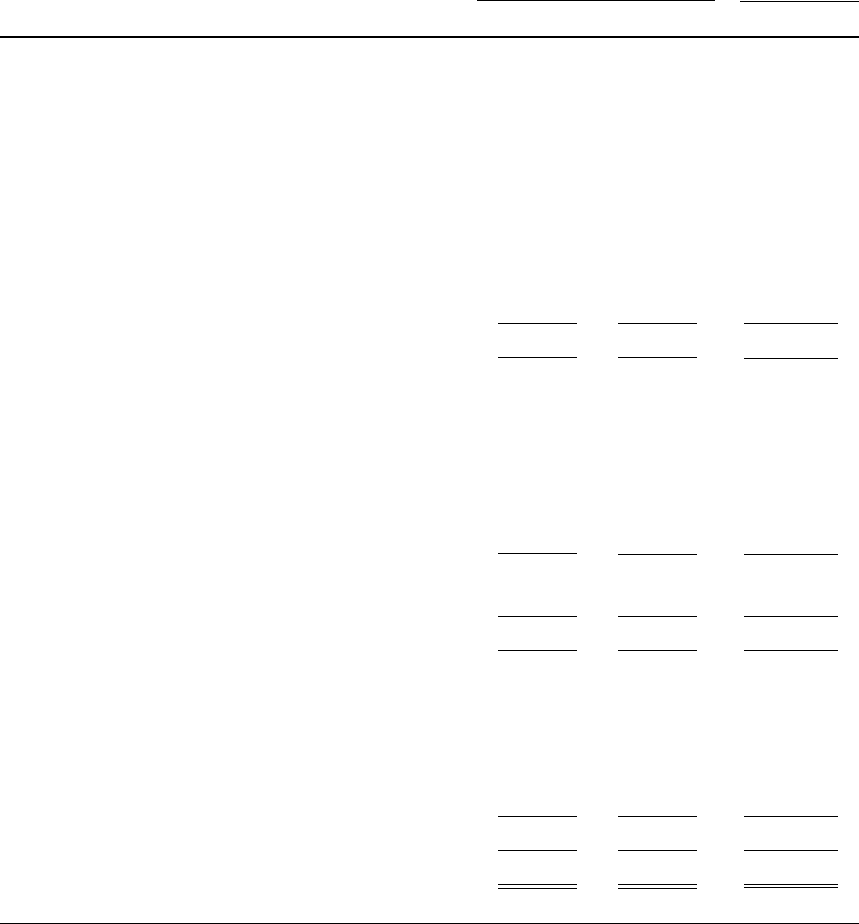
SUZUKI MOTOR CORPORATION Millions of yen U.S. dollars
2000 1999 2000
ASSETS
Current assets:
Cash and time deposits........................................................ ¥164,600 ¥191,996 $1,550,639
Marketable securities .......................................................... 3,000 9,968 28,261
Receivables:
Trade notes and accounts ................................................ 35,747 34,879 336,761
Subsidiaries and affiliates................................................ 93,546 95,908 881,267
Less allowance for doubtful receivables ......................... (577) (788) (5,435)
Inventories .......................................................................... 75,248 83,398 708,888
Other current assets ............................................................. 70,125 27,575 660,623
Total current assets 441,690 442,938 4,161,007
Property, plant and equipment:
Land .................................................................................... 88,792 92,038 836,481
Buildings and structures...................................................... 148,712 145,997 1,400,967
Machinery, equipment and vehicles ................................... 478,835 470,207 4,510,932
Construction in progress ..................................................... 4,649 985 43,803
720,990 709,228 6,792,184
Less accumulated depreciation........................................ (509,895) (488,086) (4,803,536)
211,094 221,142 1,988,648
Investments and other assets:
Investments in securities ..................................................... 67,772 53,117 638,457
Investments in subsidiaries
and affiliates .................................................................... 87,425 86,430 823,598
Other assets ......................................................................... 62,258 2,511 586,516
217,456 142,059 2,048,573
¥870,242 ¥806,140 $8,198,229
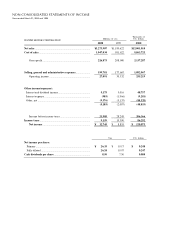
NON-CONSOLIDATED FINANCIAL STATEMENTS OF 2000
NON-CONSOLIDATED BALANCE SHEETS
As of March 31, 2000 and 1999