Suzuki 2000 Annual Report Download - page 16
Download and view the complete annual report
Please find page 16 of the 2000 Suzuki annual report below. You can navigate through the pages in the report by either clicking on the pages listed below, or by using the keyword search tool below to find specific information within the annual report.-
 1
1 -
2
-
3
-
4
-
5
-
 6
6 -
 7
7 -
 8
8 -
 9
9 -
 10
10 -
 11
11 -
 12
12 -
 13
13 -
 14
14 -
 15
15 -
 16
16 -
 17
17 -
 18
18 -
 19
19 -
 20
20 -
 21
21 -
 22
22 -
 23
23 -
 24
24 -
 25
25 -
 26
26 -
27
-
28
-
29
-
30
-
31
-
32
-
33
-
34
-
35
-
36
-
37
-
38
-
39
 |
 |

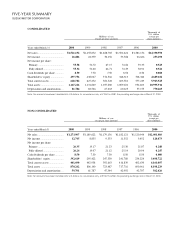
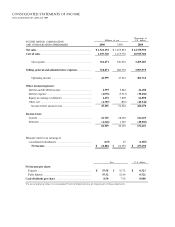
Years ended March 31 2000 1999 1998 1997 1996 2000
Net sales...................................... ¥1,521,192 ¥1,455,832 ¥1,488,785 ¥1,502,424 ¥1,381,132 $14,330,590
Net income.................................. 26,886 24,359 30,156 33,586 26,626 253,290
Net income per share:
Primary ..................................... 55.58 52.72 67.17 74.84 59.35 0.523
Fully diluted.............................. 55.32 52.40 66.71 74.29 58.91 0.521
Cash dividends per share ............ 8.50 7.50 7.50 8.50 8.50 0.080
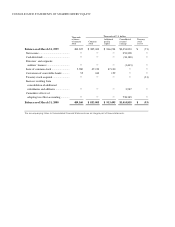
Shareholders’ equity ................... 497,756 438,047 374,566 348,313 318,342 4,689,182
Total current assets ..................... 628,782 627,232 581,328 603,581 577,219 5,923,525
Total assets ................................. 1,167,216 1,131,849 1,037,280 1,009,631 952,603 10,995,916
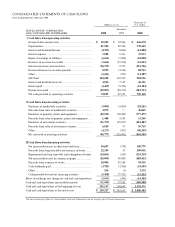
Depreciation and amortization ... 81,784 82,546 67,263 60,225 57,175 770,463
Note: Yen amounts have been translated into U.S.dollars, for convenience only, at ¥106.15=US$1, the prevailing exchange rate on March 31, 2000.
FIVE-YEAR SUMMARY
SUZUKI MOTOR CORPORATION
CONSOLIDATED
NON-CONSOLIDATED
Thousands of
U.S. dollars
Millions of yen (except per
(except per share amounts) share amounts)
Years ended March 31 2000 1999 1998 1997 1996 2000
Net sales...................................... ¥1,273,907 ¥1,189,622 ¥1,179,136 ¥1,182,121 ¥1,120,944 $12,001,010
Net income.................................. 12,745 8,855 9,533 11,352 9,452 120,073
Net income per share:
Primary ..................................... 26.35 19.17 21.23 25.30 21.07 0.248
Fully diluted.............................. 26.24 19.07 21.12 25.14 20.94 0.247
Cash dividends per share ............ 8.50 7.50 7.50 8.50 8.50 0.080
Shareholders’ equity ................... 392,619 295,422 247,350 241,780 234,224 3,698,722
Total current assets ..................... 441,690 442,938 392,663 416,839 402,630 4,161,007
Total assets ................................. 870,242 806,140 723,487 717,716 690,961 8,198,229
Depreciation and amortization ... 59,701 61,787 47,344 42,992 42,707 562,426
Note: Yen amounts have been translated into U.S.dollars, for convenience only, at ¥106.15=US$1, the prevailing exchange rate on March 31, 2000.
Thousands of
U.S. dollars
Millions of yen (except per
(except per share amounts) share amounts)