Suzuki 2000 Annual Report Download - page 31
Download and view the complete annual report
Please find page 31 of the 2000 Suzuki annual report below. You can navigate through the pages in the report by either clicking on the pages listed below, or by using the keyword search tool below to find specific information within the annual report.-
 1
1 -
2
-
3
-
4
-
5
-
6
-
7
-
8
-
9
-
10
-
11
-
12
-
13
-
14
-
15
-
16
-
17
-
18
-
19
-
20
-
 21
21 -
 22
22 -
 23
23 -
 24
24 -
 25
25 -
 26
26 -
 27
27 -
 28
28 -
 29
29 -
 30
30 -
 31
31 -
 32
32 -
 33
33 -
 34
34 -
 35
35 -
 36
36 -
 37
37 -
 38
38 -
 39
39
 |
 |

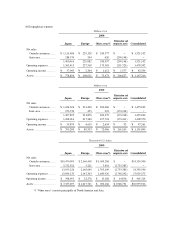
Millions of yen
2000
Elimination and
Motorcycle Automobile Other
corporate assets
Consolidated
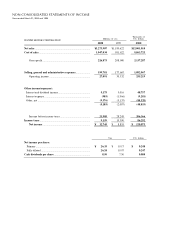
Net sales:
Outside customers ................ ¥ 213,659 ¥ 1,234,846 ¥ 72,686 ¥ −¥ 1,521,192
Inter-area............................ − − − − −
213,659 1,234,846 72,686 − 1,521,192
Operating expenses............... 207,337 1,200,546 70,709 −1,478,592
Operating income ................. 6,321 34,300 1,977 −42,599
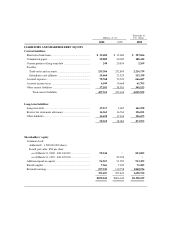
Assets.................................... 148,538 728,367 53,662 236,647 1,167,216
Depreciation ......................... 12,468 67,690 1,626 − 81,784
Capital expenditures ............. ¥ 13,938 ¥ 63,457 ¥ 1,196 ¥ − ¥ 78,592
Millions of yen
1999
Elimination and
Motorcycle Automobile Other
corporate assets
Consolidated
Net sales:
Outside customers ................ ¥ 240,996 ¥ 1,142,195 ¥ 72,640 −¥ 1,455,832
Inter-area............................ − − − − −
240,996 1,142,195 72,640 −1,455,832
Operating expenses............... 227,614 1,109,658 71,298 −1,408,570
Operating income ................. 13,382 32,536 1,342 −47,261
Assets.................................... 154,066 645,096 44,568 288,117 1,131,849
Depreciation ......................... 12,609 68,169 1,767 −82,546
Capital expenditures ............. ¥ 12,589 ¥ 83,267 ¥ 1,301 ¥ − ¥ 97,159
Thousands of U.S. dollars
2000
Elimination and
Motorcycle Automobile Other
corporate assets
Consolidated
Net sales:
Outside customers ................ $ 2,012,806 $11,633,034 $ 684,749 $ −$
14,330,590
Inter-area............................ − − − − −
2,012,806 11,633,034 684,749 −14,330,590
Operating expenses............... 1,953,250 11,309,901 666,123 −13,929,275
Operating income ................. 59,555 323,133 18,625 −401,314
Assets.................................... 1,399,325 6,861,685 505,534 2,229,370 10,995,916
Depreciation ......................... 117,456 637,686 15,320 − 770,463
Capital expenditures ............. $ 131,311 $ 597,808 $ 11,270 $ − $
740,390
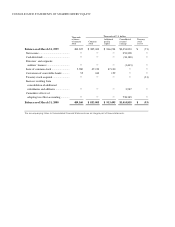
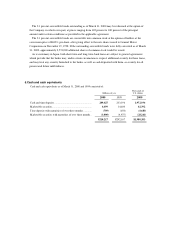
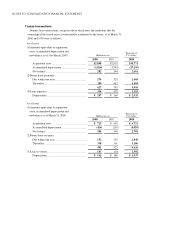
10.Segment Information
(a)Business segment
NOTES TO CONSOLIDATED FINANCIAL STATEMENTS