Singapore Airlines 2014 Annual Report Download - page 76
Download and view the complete annual report
Please find page 76 of the 2014 Singapore Airlines annual report below. You can navigate through the pages in the report by either clicking on the pages listed below, or by using the keyword search tool below to find specific information within the annual report.-
 1
1 -
 2
2 -
 3
3 -
 4
4 -
 5
5 -
 6
6 -
 7
7 -
 8
8 -
 9
9 -
 10
10 -
 11
11 -
 12
12 -
 13
13 -
 14
14 -
 15
15 -
 16
16 -
 17
17 -
 18
18 -
 19
19 -
 20
20 -
 21
21 -
 22
22 -
 23
23 -
 24
24 -
 25
25 -
 26
26 -
 27
27 -
 28
28 -
 29
29 -
 30
30 -
 31
31 -
 32
32 -
 33
33 -
 34
34 -
 35
35 -
 36
36 -
 37
37 -
 38
38 -
 39
39 -
 40
40 -
 41
41 -
 42
42 -
 43
43 -
 44
44 -
 45
45 -
 46
46 -
 47
47 -
 48
48 -
 49
49 -
 50
50 -
 51
51 -
 52
52 -
 53
53 -
 54
54 -
 55
55 -
 56
56 -
 57
57 -
 58
58 -
 59
59 -
 60
60 -
 61
61 -
 62
62 -
 63
63 -
 64
64 -
 65
65 -
 66
66 -
 67
67 -
 68
68 -
 69
69 -
 70
70 -
 71
71 -
 72
72 -
 73
73 -
 74
74 -
 75
75 -
 76
76 -
 77
77 -
 78
78 -
 79
79 -
 80
80 -
 81
81 -
 82
82 -
 83
83 -
 84
84 -
 85
85 -
 86
86 -
 87
87 -
 88
88 -
 89
89 -
 90
90 -
 91
91 -
 92
92 -
 93
93 -
 94
94 -
 95
95 -
 96
96 -
 97
97 -
 98
98 -
 99
99 -
 100
100 -
 101
101 -
 102
102 -
 103
103 -
 104
104 -
 105
105 -
 106
106 -
 107
107 -
 108
108 -
 109
109 -
 110
110 -
 111
111 -
 112
112 -
 113
113 -
 114
114 -
 115
115 -
 116
116 -
 117
117 -
 118
118 -
 119
119 -
 120
120 -
 121
121 -
 122
122 -
 123
123 -
 124
124 -
 125
125 -
 126
126 -
 127
127 -
 128
128 -
 129
129 -
 130
130 -
 131
131 -
 132
132 -
 133
133 -
 134
134 -
 135
135 -
 136
136 -
 137
137 -
 138
138 -
 139
139 -
 140
140 -
 141
141 -
 142
142 -
 143
143 -
 144
144 -
 145
145 -
 146
146 -
 147
147 -
 148
148 -
 149
149 -
 150
150 -
 151
151 -
 152
152 -
 153
153 -
 154
154 -
 155
155 -
 156
156 -
 157
157 -
 158
158 -
 159
159 -
 160
160 -
 161
161 -
 162
162 -
 163
163 -
 164
164 -
 165
165 -
 166
166 -
 167
167 -
 168
168 -
 169
169 -
 170
170 -
 171
171 -
 172
172 -
 173
173 -
 174
174 -
 175
175 -
 176
176 -
 177
177 -
 178
178 -
 179
179 -
 180
180 -
 181
181 -
 182
182 -
 183
183 -
 184
184 -
 185
185 -
 186
186 -
 187
187 -
 188
188 -
 189
189 -
 190
190 -
 191
191 -
 192
192 -
 193
193 -
 194
194 -
 195
195 -
 196
196 -
 197
197 -
 198
198 -
 199
199 -
 200
200 -
 201
201 -
 202
202 -
 203
203 -
 204
204 -
 205
205 -
 206
206 -
 207
207 -
 208
208 -
 209
209 -
 210
210 -
 211
211 -
 212
212 -
 213
213 -
 214
214 -
 215
215 -
 216
216 -
 217
217 -
 218
218 -
 219
219 -
 220
220
 |
 |

074
SINGAPORE AIRLINES
Performance of the Group (continued)
Financial Position
As at 31 March 2014, equity attributable to owners of the Parent increased by $148 million or 1.1 per cent to $13,237 million
due mainly to profit for the financial year (+$359 million) and realisation of reserves from disposal of Virgin Atlantic Limited
(+$117 million), partially offset by the payment of final dividend of 2012/13 (-$200 million) and payment of 2013/14 interim
dividend (-$118 million).
Total Group assets increased by $215 million or 1.0 per cent to $22,643 million as at 31 March 2014 mainly due to higher
long-term investments (+$418 million) and investment in associated companies (+$175 million), partially offset by a decrease
in cash and bank balances (-$176 million) and other receivables (-$122 million). The increase in long-term investments and
investment in associated companies was driven by purchase of additional shares and participation in the fund raising exercises
for Virgin Australia Holdings Limited and Tiger Airways Holding Limited respectively. These were largely funded by cashflow
from operations and other cash resources. Net asset value per share was up 1.1 per cent to $11.26.
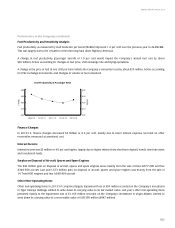
The Group’s net liquid assetsR1 decreased by $189 million to $4,206 million as at 31 March 2014, largely due to lower cash
and bank balances (-$176 million). The lower cash and bank balances was primarily due to capital expenditure, purchase of
long-term investments, dividend payments and investment in associated companies, partially offset by proceeds from disposal
of fixed assets and Virgin Atlantic Limited, and operational cash flows. Total debt to equity ratio decreased by 0.01 times to
0.07 times as at 31 March 2014.
R1 Net liquid assets is defined as the sum of cash and bank balances, investments, and net of finance lease commitments, loans and bonds issued.
Group Net Liquid Assets
$ Million
6,000
4,000
5,000
3,000
2,000
1,000
0
$ Million
1,000
2,000
3,000
4,000
5,000
6,000
0
2010 2011 2012 2013
FINANCIAL REVIEW
GroupEquityHolders’Funds,TotalAssets
and Net Asset Value (NAV) per Share
$ Million
30,000
20,000
25,000
15,000
10,000
5,000
0
Dollars
2
4
6
8
10
12
14
0
2010 2011 2012 2013 2014
2014
