Singapore Airlines 2014 Annual Report Download - page 162
Download and view the complete annual report
Please find page 162 of the 2014 Singapore Airlines annual report below. You can navigate through the pages in the report by either clicking on the pages listed below, or by using the keyword search tool below to find specific information within the annual report.-
 1
1 -
2
-
3
-
4
-
5
-
6
-
7
-
8
-
9
-
10
-
11
-
12
-
13
-
14
-
15
-
16
-
17
-
18
-
19
-
20
-
21
-
22
-
23
-
24
-
25
-
26
-
27
-
28
-
29
-
30
-
31
-
32
-
33
-
34
-
35
-
36
-
37
-
38
-
39
-
40
-
41
-
42
-
43
-
44
-
45
-
46
-
47
-
48
-
49
-
50
-
51
-
52
-
53
-
54
-
55
-
56
-
57
-
58
-
59
-
60
-
61
-
62
-
63
-
64
-
65
-
66
-
67
-
68
-
69
-
70
-
71
-
72
-
73
-
74
-
75
-
76
-
77
-
78
-
79
-
80
-
81
-
82
-
83
-
84
-
85
-
86
-
87
-
88
-
89
-
90
-
91
-
92
-
93
-
94
-
95
-
96
-
97
-
98
-
99
-
100
-
101
-
102
-
103
-
104
-
105
-
106
-
107
-
108
-
109
-
110
-
111
-
112
-
113
-
114
-
115
-
116
-
117
-
118
-
119
-
120
-
121
-
122
-
123
-
124
-
125
-
126
-
127
-
128
-
129
-
130
-
131
-
132
-
133
-
134
-
135
-
136
-
137
-
138
-
139
-
140
-
141
-
142
-
143
-
144
-
145
-
146
-
147
-
148
-
149
-
150
-
151
-
 152
152 -
 153
153 -
 154
154 -
 155
155 -
 156
156 -
 157
157 -
 158
158 -
 159
159 -
 160
160 -
 161
161 -
 162
162 -
 163
163 -
 164
164 -
 165
165 -
 166
166 -
 167
167 -
 168
168 -
 169
169 -
 170
170 -
 171
171 -
 172
172 -
173
-
174
-
175
-
176
-
177
-
178
-
179
-
180
-
181
-
182
-
183
-
184
-
185
-
186
-
187
-
188
-
189
-
190
-
191
-
192
-
193
-
194
-
195
-
196
-
197
-
198
-
199
-
200
-
201
-
202
-
203
-
204
-
205
-
206
-
207
-
208
-
209
-
210
-
211
-
212
-
213
-
214
-
215
-
216
-
217
-
218
-
219
-
220
 |
 |

160
NOTES TO THE FINANCIAL STATEMENTS
31 March 2014
SINGAPORE AIRLINES
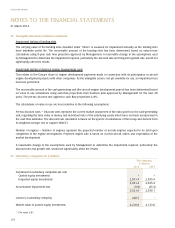
21 Property,PlantandEquipment(in$million)(continued)
The Company
Aircraft Aircraft spare
Aircraft spares engines
Cost
At 1 April 2012 15,610.0 448.2 187.7
Additions 123.9 14.1 -
Transfers 1,264.7 - (70.2)
Disposals (1,638.2) (24.2) (45.2)
At 31 March 2013 15,360.4 438.1 72.3
Additions 101.5 8.8 -
Transfers 1,280.4 - 17.9
Disposals (1,838.0) (110.8) (40.0)
At 31 March 2014 14,904.3 336.1 50.2
Accumulated depreciation and impairment loss
At 1 April 2012 6,624.5 280.6 116.9
Depreciation 1,175.3 17.2 12.5
Impairment loss 7.0 - -
Transfers 56.0 - (59.8)
Disposals (1,056.3) (13.4) (36.5)
At 31 March 2013 6,806.5 284.4 33.1
Depreciation 1,192.6 17.0 4.7
Impairment loss 9.0 10.0 -
Transfers 3.5 - (3.5)
Disposals (1,335.9) (89.3) (19.6)
At 31 March 2014 6,675.7 222.1 14.7
Net book value
At 31 March 2013 8,553.9 153.7 39.2
At 31 March 2014 8,228.6 114.0 35.5