Singapore Airlines 2009 Annual Report Download - page 56
Download and view the complete annual report
Please find page 56 of the 2009 Singapore Airlines annual report below. You can navigate through the pages in the report by either clicking on the pages listed below, or by using the keyword search tool below to find specific information within the annual report.-
 1
1 -
2
-
3
-
4
-
5
-
6
-
7
-
8
-
9
-
10
-
11
-
12
-
13
-
14
-
15
-
16
-
17
-
18
-
19
-
20
-
21
-
22
-
23
-
24
-
25
-
26
-
27
-
28
-
29
-
30
-
31
-
32
-
33
-
34
-
35
-
36
-
37
-
38
-
39
-
40
-
41
-
42
-
43
-
44
-
45
-
 46
46 -
 47
47 -
 48
48 -
 49
49 -
 50
50 -
 51
51 -
 52
52 -
 53
53 -
 54
54 -
 55
55 -
 56
56 -
 57
57 -
 58
58 -
 59
59 -
 60
60 -
 61
61 -
 62
62 -
 63
63 -
 64
64 -
 65
65 -
 66
66 -
67
-
68
-
69
-
70
-
71
-
72
-
73
-
74
-
75
-
76
-
77
-
78
-
79
-
80
-
81
-
82
-
83
-
84
-
85
-
86
-
87
-
88
-
89
-
90
-
91
-
92
-
93
-
94
-
95
-
96
-
97
-
98
-
99
-
100
-
101
-
102
-
103
-
104
-
105
-
106
-
107
-
108
-
109
-
110
-
111
-
112
-
113
-
114
-
115
-
116
-
117
-
118
-
119
-
120
-
121
-
122
-
123
-
124
-
125
-
126
-
127
-
128
-
129
-
130
-
131
-
132
-
133
-
134
-
135
-
136
-
137
-
138
-
139
-
140
-
141
-
142
-
143
-
144
-
145
-
146
-
147
-
148
-
149
-
150
-
151
-
152
-
153
-
154
-
155
-
156
-
157
-
158
-
159
-
160
-
161
-
162
-
163
-
164
-
165
-
166
-
167
-
168
-
169
-
170
-
171
-
172
-
173
-
174
-
175
-
176
-
177
-
178
-
179
-
180
-
181
-
182
-
183
-
184
-
185
-
186
-
187
-
188
-
189
-
190
-
191
-
192
-
193
-
194
-
195
-
196
-
197
-
198
-
199
-
200
-
201
-
202
-
203
-
204
-
205
-
206
-
207
-
208
-
209
-
210
-
211
-
212
-
213
-
214
-
215
-
216
-
217
-
218
-
219
-
220
-
221
-
222
-
223
-
224
 |
 |

54
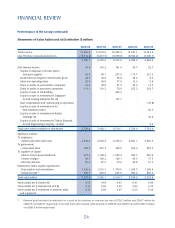
Performance of the Group (continued)
Statements of Value Added and its Distribution ($ million)
2008-09 2007-08 2006-07 2005-06 2004-05
Total revenue 15,996.3 15,972.5 14,494.4 13,341.1 12,012.9
Less: Purchase of goods and services (10,810.2) (9,413.3) (9,078.6) (8,352.2) (7,030.7)
5,186.1 6,559.2 5,415.8 4,988.9 4,982.2
Add: Interest income 96.0 181.2 181.8 96.7 52.7
Surplus on disposal of aircraft, spares
and spare engines 60.6 49.1 237.9 115.7 215.2
Dividends from long-term investments, gross 23.7 34.8 38.8 24.6 8.0
Other non-operating items 29.4 96.8 77.9 12.3 9.8
Share of profi ts of joint venture companies 63.9 50.8 57.9 40.6 12.5
Share of profi ts of associated companies 111.1 110.2 79.0 255.2 203.7
Surplus on sale of SIA Building - - 223.3 - -
Surplus on sale of investment in Singapore
Aircraft Leasing Enterprise Pte Ltd - - 197.7 - -
Staff compensation and restructuring of operations - - - - (37.8)
Surplus on sale of investment in Air
New Zealand Limited - - - - 45.7
Surplus on sale of investment in Raffl es
Holdings Ltd - - - - 32.6
Surplus on sale of investment in Taikoo (Xiamen)
Aircraft Engineering Company Limited - - - - 9.0
Total value added available for distribution 5,570.8 7,082.1 6,510.1 5,534.0 5,533.6
Applied as follows:
To employees
- Salaries and other staff costs 2,545.9 2,903.4 2,727.4 2,481.1 2,456.5
To government
- Corporation taxes 190.0 410.3 328.9 352.6 387.3
To suppliers of capital
- Interim and proposed dividends 473.6 1,184.4 1,245.2 550.5 487.4
- Finance charges 89.7 100.2 124.1 96.3 77.5
- Minority interests 85.3 87.5 73.6 68.8 51.3
Retained for future capital requirements
- Depreciation and amortisation 1,736.6 1,531.3 1,374.0 1,294.5 1,208.6
- Retained profi t R1 449.7 865.0 636.9 690.2 865.0
Total value added 5,570.8 7,082.1 6,510.1 5,534.0 5,533.6
Value added per $ revenue ($) 0.35 0.44 0.45 0.41 0.46
Value added per $ employment cost ($) 2.19 2.44 2.39 2.23 2.25
Value added per $ investment in property, plant 0.22 0.29 0.27 0.23 0.24
and equipment
R1 Retained profi t excludes tax write-back as a result of the reduction in corporate tax rate of $138.2 million and $246.7 million for
2008-09 and 2006-07 respectively. If tax write-back were included, retained profi t for 2008-09 and 2006-07 would be $587.9 million
and $883.6 million respectively.
FINANCIAL REVIEW