Singapore Airlines 2009 Annual Report Download - page 175
Download and view the complete annual report
Please find page 175 of the 2009 Singapore Airlines annual report below. You can navigate through the pages in the report by either clicking on the pages listed below, or by using the keyword search tool below to find specific information within the annual report.-
 1
1 -
2
-
3
-
4
-
5
-
6
-
7
-
8
-
9
-
10
-
11
-
12
-
13
-
14
-
15
-
16
-
17
-
18
-
19
-
20
-
21
-
22
-
23
-
24
-
25
-
26
-
27
-
28
-
29
-
30
-
31
-
32
-
33
-
34
-
35
-
36
-
37
-
38
-
39
-
40
-
41
-
42
-
43
-
44
-
45
-
46
-
47
-
48
-
49
-
50
-
51
-
52
-
53
-
54
-
55
-
56
-
57
-
58
-
59
-
60
-
61
-
62
-
63
-
64
-
65
-
66
-
67
-
68
-
69
-
70
-
71
-
72
-
73
-
74
-
75
-
76
-
77
-
78
-
79
-
80
-
81
-
82
-
83
-
84
-
85
-
86
-
87
-
88
-
89
-
90
-
91
-
92
-
93
-
94
-
95
-
96
-
97
-
98
-
99
-
100
-
101
-
102
-
103
-
104
-
105
-
106
-
107
-
108
-
109
-
110
-
111
-
112
-
113
-
114
-
115
-
116
-
117
-
118
-
119
-
120
-
121
-
122
-
123
-
124
-
125
-
126
-
127
-
128
-
129
-
130
-
131
-
132
-
133
-
134
-
135
-
136
-
137
-
138
-
139
-
140
-
141
-
142
-
143
-
144
-
145
-
146
-
147
-
148
-
149
-
150
-
151
-
152
-
153
-
154
-
155
-
156
-
157
-
158
-
159
-
160
-
161
-
162
-
163
-
164
-
 165
165 -
 166
166 -
 167
167 -
 168
168 -
 169
169 -
 170
170 -
 171
171 -
 172
172 -
 173
173 -
 174
174 -
 175
175 -
 176
176 -
 177
177 -
 178
178 -
 179
179 -
 180
180 -
 181
181 -
 182
182 -
 183
183 -
 184
184 -
 185
185 -
186
-
187
-
188
-
189
-
190
-
191
-
192
-
193
-
194
-
195
-
196
-
197
-
198
-
199
-
200
-
201
-
202
-
203
-
204
-
205
-
206
-
207
-
208
-
209
-
210
-
211
-
212
-
213
-
214
-
215
-
216
-
217
-
218
-
219
-
220
-
221
-
222
-
223
-
224
 |
 |

173
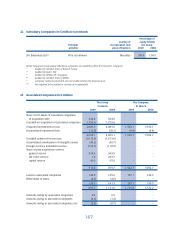
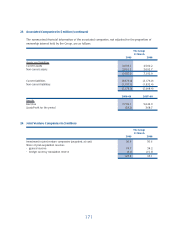
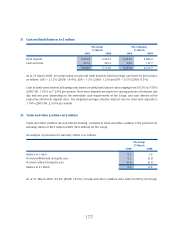
25 Long-Term Investments (in $ million)
The Group The Company
31 March 31 March
2009 2008 2009 2008
Unquoted equity investments 52.4 52.4 28.0 28.0
Accumulated impairment loss (9.2) (9.1) (9.2) (9.1)
43.2 43.3 18.8 18.9
Analysis of accumulated impairment loss:
Balance at 1 April 9.1 9.1 9.1 9.1
Charged during the year 0.1 - 0.1 -
Balance at 31 March 9.2 9.1 9.2 9.1
During the fi nancial year, the Group and the Company recorded an impairment loss in the profi t and loss
account of $0.1 million (2007-08: nil) pertaining to unquoted equity investments.
26 Other Non-Current Assets (in $ million)
The Group The Company
31 March 31 March
2009 2008 2009 2008
Other receivables 391.6 353.6 391.6 353.6
Investments in companies pending
incorporation 12.0 8.2 - -
403.6 361.8 391.6 353.6
The Group’s other receivables are stated at amortised cost and are expected to be received over a period
of 2 to 10 years. As at 31 March 2009 and 31 March 2008, the entire balance of other receivables is
denominated in USD.
The remaining non-current assets relate to capital expenditure incurred for the setting up of associated
companies which are not legally incorporated as at year-end.