Singapore Airlines 2009 Annual Report Download - page 140
Download and view the complete annual report
Please find page 140 of the 2009 Singapore Airlines annual report below. You can navigate through the pages in the report by either clicking on the pages listed below, or by using the keyword search tool below to find specific information within the annual report.-
 1
1 -
2
-
3
-
4
-
5
-
6
-
7
-
8
-
9
-
10
-
11
-
12
-
13
-
14
-
15
-
16
-
17
-
18
-
19
-
20
-
21
-
22
-
23
-
24
-
25
-
26
-
27
-
28
-
29
-
30
-
31
-
32
-
33
-
34
-
35
-
36
-
37
-
38
-
39
-
40
-
41
-
42
-
43
-
44
-
45
-
46
-
47
-
48
-
49
-
50
-
51
-
52
-
53
-
54
-
55
-
56
-
57
-
58
-
59
-
60
-
61
-
62
-
63
-
64
-
65
-
66
-
67
-
68
-
69
-
70
-
71
-
72
-
73
-
74
-
75
-
76
-
77
-
78
-
79
-
80
-
81
-
82
-
83
-
84
-
85
-
86
-
87
-
88
-
89
-
90
-
91
-
92
-
93
-
94
-
95
-
96
-
97
-
98
-
99
-
100
-
101
-
102
-
103
-
104
-
105
-
106
-
107
-
108
-
109
-
110
-
111
-
112
-
113
-
114
-
115
-
116
-
117
-
118
-
119
-
120
-
121
-
122
-
123
-
124
-
125
-
126
-
127
-
128
-
129
-
 130
130 -
 131
131 -
 132
132 -
 133
133 -
 134
134 -
 135
135 -
 136
136 -
 137
137 -
 138
138 -
 139
139 -
 140
140 -
 141
141 -
 142
142 -
 143
143 -
 144
144 -
 145
145 -
 146
146 -
 147
147 -
 148
148 -
 149
149 -
 150
150 -
151
-
152
-
153
-
154
-
155
-
156
-
157
-
158
-
159
-
160
-
161
-
162
-
163
-
164
-
165
-
166
-
167
-
168
-
169
-
170
-
171
-
172
-
173
-
174
-
175
-
176
-
177
-
178
-
179
-
180
-
181
-
182
-
183
-
184
-
185
-
186
-
187
-
188
-
189
-
190
-
191
-
192
-
193
-
194
-
195
-
196
-
197
-
198
-
199
-
200
-
201
-
202
-
203
-
204
-
205
-
206
-
207
-
208
-
209
-
210
-
211
-
212
-
213
-
214
-
215
-
216
-
217
-
218
-
219
-
220
-
221
-
222
-
223
-
224
 |
 |

138
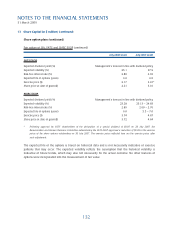
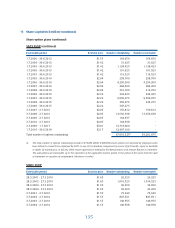
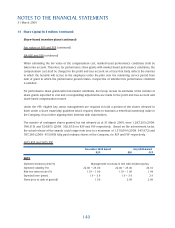
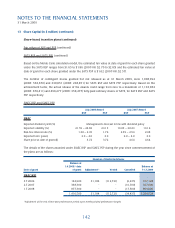
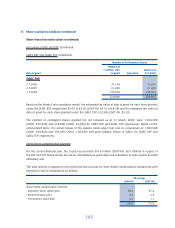
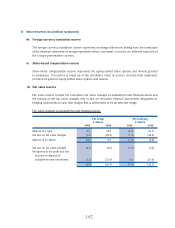
13 Share Capital (in $ million) (continued)
Share-based incentive plans (continued)
RSP PSP
Vesting Condition Based on meeting stated performance Vesting based on meeting stated
conditions over a two-year performance performance conditions over a
period, 50% of award will vest. three-year performance period.
Balance will vest equally over the
subsequent two years with
fulfi lment of service requirements.
Payout
SIA and SATS 0% - 120% depending on the 0% - 150% depending on the
achievement of pre-set performance achievement of pre-set performance
targets over the performance period. targets over the performance period.
SIAEC 0% - 150% depending on the 0% - 200% depending on the
achievement of pre-set performance achievement of pre-set performance
targets over the performance period. targets over the performance period.
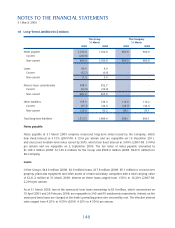
Fair values of RSP and PSP
SIA RSP and PSP
The fair value of services received in return for shares awarded is measured by reference to the fair value of
shares granted each year under the SIA RSP and PSP. The estimate of the fair value of the services received
is measured based on a Monte Carlo simulation model, which involves projection of future outcomes using
statistical distributions of key random variables including share price and volatility of returns.
The following table lists the key inputs to the model used for the July 2008 and August 2007 awards:
July 2008 Award August 2007 Award
RSP PSP RSP PSP
SIA
Expected dividend yield (%) Management’s forecast in line with dividend policy
Expected volatility (%) 20.20 – 22.15 21.08 18.30 – 19.46 18.30
Risk-free interest rate (%) 1.30 – 2.35 1.76 2.41 – 2.61 2.48
Expected term (years) 2.0 – 4.0 3.0 1.9 – 3.9 2.9
Share price at date of grant ($) 14.60 14.60 18.90 18.90
NOTES TO THE FINANCIAL STATEMENTS
31 March 2009