Singapore Airlines 2009 Annual Report Download - page 54
Download and view the complete annual report
Please find page 54 of the 2009 Singapore Airlines annual report below. You can navigate through the pages in the report by either clicking on the pages listed below, or by using the keyword search tool below to find specific information within the annual report.-
 1
1 -
2
-
3
-
4
-
5
-
6
-
7
-
8
-
9
-
10
-
11
-
12
-
13
-
14
-
15
-
16
-
17
-
18
-
19
-
20
-
21
-
22
-
23
-
24
-
25
-
26
-
27
-
28
-
29
-
30
-
31
-
32
-
33
-
34
-
35
-
36
-
37
-
38
-
39
-
40
-
41
-
42
-
43
-
 44
44 -
 45
45 -
 46
46 -
 47
47 -
 48
48 -
 49
49 -
 50
50 -
 51
51 -
 52
52 -
 53
53 -
 54
54 -
 55
55 -
 56
56 -
 57
57 -
 58
58 -
 59
59 -
 60
60 -
 61
61 -
 62
62 -
 63
63 -
 64
64 -
65
-
66
-
67
-
68
-
69
-
70
-
71
-
72
-
73
-
74
-
75
-
76
-
77
-
78
-
79
-
80
-
81
-
82
-
83
-
84
-
85
-
86
-
87
-
88
-
89
-
90
-
91
-
92
-
93
-
94
-
95
-
96
-
97
-
98
-
99
-
100
-
101
-
102
-
103
-
104
-
105
-
106
-
107
-
108
-
109
-
110
-
111
-
112
-
113
-
114
-
115
-
116
-
117
-
118
-
119
-
120
-
121
-
122
-
123
-
124
-
125
-
126
-
127
-
128
-
129
-
130
-
131
-
132
-
133
-
134
-
135
-
136
-
137
-
138
-
139
-
140
-
141
-
142
-
143
-
144
-
145
-
146
-
147
-
148
-
149
-
150
-
151
-
152
-
153
-
154
-
155
-
156
-
157
-
158
-
159
-
160
-
161
-
162
-
163
-
164
-
165
-
166
-
167
-
168
-
169
-
170
-
171
-
172
-
173
-
174
-
175
-
176
-
177
-
178
-
179
-
180
-
181
-
182
-
183
-
184
-
185
-
186
-
187
-
188
-
189
-
190
-
191
-
192
-
193
-
194
-
195
-
196
-
197
-
198
-
199
-
200
-
201
-
202
-
203
-
204
-
205
-
206
-
207
-
208
-
209
-
210
-
211
-
212
-
213
-
214
-
215
-
216
-
217
-
218
-
219
-
220
-
221
-
222
-
223
-
224
 |
 |

52
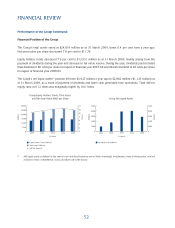
Performance of the Group (continued)
Financial Position of the Group
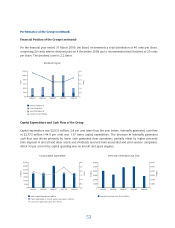
The Group’s total assets stood at $24,819 million as at 31 March 2009, down 6.4 per cent from a year ago.
Net asset value per share decreased 7.8 per cent to $11.78.
Equity holders’ funds decreased 7.9 per cent to $13,931 million as at 31 March 2009, mainly arising from the
payment of dividends during the year and decrease in fair value reserve. During the year, dividends paid included
fi nal dividend of 80 cents per share in respect of fi nancial year 2007-08 and interim dividend of 20 cents per share
in respect of fi nancial year 2008-09.
The Group’s net liquid assetsR1 position fell from $3,927 million a year ago to $2,802 million (-$1,125 million) as
at 31 March 2009, as a result of payment of divdends and lower cash generated from operations. Total debt to
equity ratio at 0.12 times was marginally higher by 0.01 times.
R1 Net liquid assets is defi ned as the sum of cash and bank balances (net of bank overdrafts), investments, loans to third parties, and net
of fi nance lease commitments, loans and fi xed rate notes issued.
FINANCIAL REVIEW
2005 2006 2007 2008 2009
31 March
2005 2006 2007 2008 2009
31 March