Quest Diagnostics 1998 Annual Report Download - page 5
Download and view the complete annual report
Please find page 5 of the 1998 Quest Diagnostics annual report below. You can navigate through the pages in the report by either clicking on the pages listed below, or by using the keyword search tool below to find specific information within the annual report.-
 1
1 -
 2
2 -
 3
3 -
 4
4 -
 5
5 -
 6
6 -
 7
7 -
 8
8 -
 9
9 -
 10
10 -
 11
11 -
 12
12 -
 13
13
 |
 |

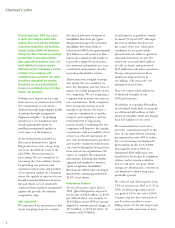
We saw average revenue per requisition
increase for the second consecutive
year, following five straight years of
declines. Partly, this was a result
of replacing low-profit business with
higher-profit business as we demon-
strated our steadfast commitment
to provide services only to those
customers from whom we are
properly compensated, even if
that means a decline in volume.
We made substantial progress during
1998 toward addressing the Year 2000
computer-programming problem.
Although substantial work remains,
we are on track to complete the first
phase on schedule midway through
1999, which will leave the second half
of the year for testing and refine-
ments. Consequently, we fully expect
core systems to be Year 2000-ready
before the end of the year. Our Year
2000 work has provided the added
benefit of accelerating efforts to
standardize billing and laboratory
systems across the country.
Nevertheless, 1998 was not without
disappointments. Our progress
toward standardization of systems
and practices was significant, but
not as swift as we had hoped. Also,
the joint venture in Arizona, Sonora
Quest Laboratories, in which we hold
a minority interest, encountered
significant integration challenges
that hindered its first year of
operations. Also, Nichols Institute
Diagnostics, our medical products
subsidiary, encountered startup losses
associated with the introduction of
its state-of-the-art Nichols Advantage
instrument.
Finally, the decline in the volume of
test requisitions was disappointing.
Admittedly, the rate of decline
slowed in the second half; moreover,
of the 7% year-over-year decline in
volume, about half was directly
attributable to our own consolidation
of facilities and to our decision to
reduce unprofitable business. Still,
we do not intend to shrink our
way to success, and we continue to
pursue top line growth through the
strategic acquisition of SBCL and
the active development of new high
growth businesses.
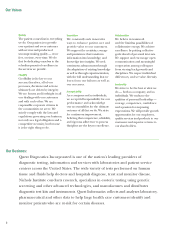
Strategic Partnerships
Your company intensified efforts to
become the preferred partner with
large buyers of health care services.
We made important inroads within
the highly competitive field of
hospital testing, which accounts
for nearly 55% of the $30-plus
billion market in clinical testing.
In part, our success comes from
viewing traditional competitors
as potential partners, and providing
ways we can profitably work together
to reduce their lab testing costs while
simultaneously improving quality.
Over time, we have come to realize
there is no “one-size-fits-all” model of
collaboration; each situation is unique
and requires creative approaches,
ranging from outsourcing routine
testing to fully integrated joint
ventures. Some of the partnerships
successfully established in 1998
include:
Joint ventures with UPMC Health
System in western Pennsylvania
and Unity Health in St. Louis, both
leading hospital network and health
care providers in their respective
regions;
Partnerships through which we
provide multiple clinical services to
5
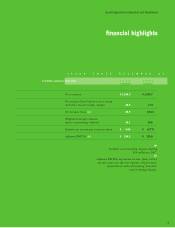
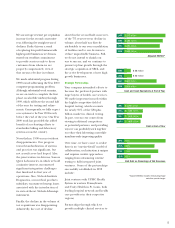
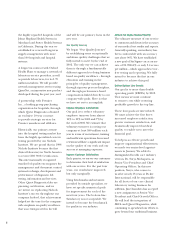
1996
1997
1998
1995
Adjusted EBITDA*
$177 million
$166 million
$154 million
$159 million
1996
1997
1998
1995
Cash and Cash Equivalents at End of Year
$ 36 million
$ 42 million
$162 million
$203 million
1996
1997
1998
1995
Debt at End of Year
$1,208 million
$ 536 million
$ 515 million
$ 465 million
1996
1997
1998
1995
Bad Debt as Percentage of Net Revenues
*Adjusted EBITDA; excludes restructuring charge
and other special charges
9.4%
6.9%
7.4%
6.1%