Qantas 2002 Annual Report Download - page 47
Download and view the complete annual report
Please find page 47 of the 2002 Qantas annual report below. You can navigate through the pages in the report by either clicking on the pages listed below, or by using the keyword search tool below to find specific information within the annual report.-
 1
1 -
2
-
3
-
4
-
5
-
6
-
7
-
8
-
9
-
10
-
11
-
12
-
13
-
14
-
15
-
16
-
17
-
18
-
19
-
20
-
21
-
22
-
23
-
24
-
25
-
26
-
27
-
28
-
29
-
30
-
31
-
32
-
33
-
34
-
35
-
36
-
 37
37 -
 38
38 -
 39
39 -
 40
40 -
 41
41 -
 42
42 -
 43
43 -
 44
44 -
 45
45 -
 46
46 -
 47
47 -
 48
48 -
 49
49 -
 50
50 -
 51
51 -
 52
52 -
 53
53 -
 54
54 -
 55
55 -
 56
56
 |
 |

2002 QANTAS ANNUAL REPORT p45
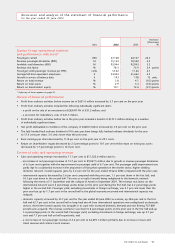
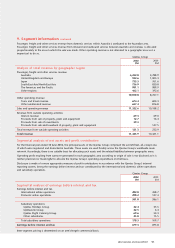
9. Segment information continued
Passenger, freight and other services revenue from domestic services within Australia is attributed to the Australian area.
Passenger, freight and other services revenue from inbound and outbound services between Australia and overseas is allocated
proportionately to the area in which the sale was made. Other operating revenue is not allocated to a geographic area as it is
impractical to do so.
Qantas Group
2002 2001
$M $M
Analysis of total revenue by geographic region
Passenger, freight and other services revenue
Australia 6,232.8 4,788.9
United Kingdom and Europe 942.6 1,003.3
Japan 735.3 761.6
South-East Asia/North-East Asia 736.9 830.8
The Americas and the Pacific 901.1 989.9
Other regions 462.1 392.6
10,010.8 8,767.1
Other operating revenue
Tours and travel revenue 674.4 604.3
Other unallocated revenue 637.4 816.8
Sales and operating revenue 11,322.6 10,188.2
Revenue from outside operating activities
Interest revenue 69.3 69.0
Proceeds from sale of property, plant and equipment 12.7 16.4
Proceeds from sale of investments 39.3 –
Proceeds from sale and leaseback of property, plant and equipment –147.5
Total revenue from outside operating activities 121.3 232.9
Total revenue 11,443.9 10,421.1
Segmental analysis of net assets and profit contribution
For the financial year ended 30 June 2002, the principal assets of the Qantas Group comprised the aircraft fleet, all, except one,
of which were registered and domiciled in Australia. These assets are used flexibly across the Qantas Group’s worldwide route
network. Accordingly, there is no suitable basis for allocating such assets and the related liabilities between geographic areas.
Operating profit resulting from turnover generated in each geographic area according to origin of sale is not disclosed as it is
neither practical nor meaningful to allocate the Qantas Group’s operating expenditure on that basis.
Disclosure is made of a more appropriate measure of profit contributions in accordance with the Qantas Group’s internal
reporting system, being the earnings before interest and tax contributed by the international and domestic airline operations
and subsidiary operations.
Qantas Group
2002 2001
$M $M
Segmental analysis of earnings before interest and tax
Earnings before interest and tax
International airline operations 202.8 458.7
Domestic airline operations 298.2 127.4
501.0 586.1
Subsidiary operations
Qantas Holidays Group 42.4 33.5
QantasLink Group 42.5 6.4
Qantas Flight Catering Group 69.6 54.3
Other subsidiaries 23.8 15.5
Total subsidiary operations 178.3 109.7
Earnings before interest and tax 679.3 695.8
Inter-segment pricing is determined on an arm’s-length commercial basis.