Public Storage 2007 Annual Report Download - page 8
Download and view the complete annual report
Please find page 8 of the 2007 Public Storage annual report below. You can navigate through the pages in the report by either clicking on the pages listed below, or by using the keyword search tool below to find specific information within the annual report.-
 1
1 -
 2
2 -
 3
3 -
 4
4 -
 5
5 -
 6
6 -
 7
7 -
 8
8 -
 9
9 -
 10
10 -
 11
11 -
 12
12 -
 13
13 -
 14
14 -
 15
15 -
 16
16 -
 17
17 -
 18
18 -
 19
19 -
20
-
21
-
22
-
23
-
24
-
25
-
26
-
27
-
28
-
29
-
30
-
31
-
32
-
33
-
34
-
35
-
36
-
37
-
38
-
39
-
40
-
41
-
42
-
43
-
44
-
45
-
46
-
47
-
48
-
49
-
50
-
51
-
52
-
53
-
54
-
55
-
56
-
57
-
58
-
59
-
60
-
61
-
62
-
63
-
64
-
65
-
66
-
67
-
68
-
69
-
70
-
71
-
72
-
73
-
74
-
75
-
76
-
77
-
78
-
79
-
80
-
81
-
82
-
83
-
84
-
85
-
86
-
87
-
88
-
89
-
90
-
91
-
92
-
93
-
94
-
95
-
96
-
97
-
98
-
99
-
100
-
101
-
102
-
103
-
104
-
105
-
106
-
107
-
108
-
109
-
110
-
111
-
112
-
113
-
114
-
115
-
116
-
117
-
118
-
119
-
120
-
121
-
122
-
123
-
124
-
125
-
126
-
127
-
128
-
129
-
130
-
131
-
132
-
133
-
134
-
135
-
136
-
137
-
138
-
139
-
140
-
141
-
142
-
143
-
144
-
145
-
146
-
147
-
148
-
149
-
150
-
151
-
152
-
153
-
154
-
155
-
156
 |
 |

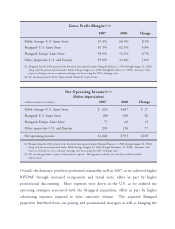
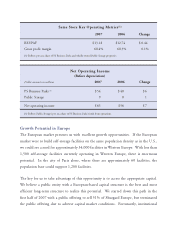
Gross Profit Margin(1)(2)
2007 2006 Change
Public Storage–U.S. Same Store 67.4% 66.9% 0.5%
Shurgard–U.S. Same Store 67.3% 62.5% 4.8%
Shurgard–Europe Same Store 59.9% 53.2% 6.7%
Other properties–U.S. and Europe 59.0% 54.0% 5.0%
(1) Shurgard data for 2006 represents the historical data operated under Shurgard (January 1, 2006 through August 22, 2006)
along with the period operated under Public Storage (August 23, 2006 through December 31, 2006). Amounts with
respect to Europe are on a constant exchange rate basis using the 2007 exchange ratio.
(2) Net operating income (before depreciation) divided by total revenues.
Net Operating Income(1)(2)
(Before depreciation)
Dollar amounts in millions 2007 2006 Change
Public Storage–U.S. Same Store $ 624 $ 607 $ 17
Shurgard–U.S. Same Store 180 160 20
Shurgard–Europe Same Store 77 62 15
Other properties–U.S. and Europe 201 124 77
Net operating income $1,082 $ 953 $129
(1) Shurgard data for 2006 represents the historical data operated under Shurgard (January 1, 2006 through August 22, 2006)
along with the period operated under Public Storage (August 23, 2006 through December 31, 2006). Amounts with
respect to Europe are on a constant exchange rate basis using the 2007 exchange ratio.
(2) Net operating income is prior to depreciation expense. Management evaluates net cash flows which excludes
depreciation.
Overall, the domestic portfolio performed reasonably well in 2007, as we achieved higher
REVPAF through increased occupancies and rental rates, offset in part by higher
promotional discounting. Most expenses were down in the U.S. as we realized the
operating synergies associated with the Shurgard acquisition, offset in part by higher
advertising expenses required to drive customer volume. The acquired Shurgard
properties benefited from our pricing and promotional strategies as well as bringing the