Public Storage 2007 Annual Report Download - page 10
Download and view the complete annual report
Please find page 10 of the 2007 Public Storage annual report below. You can navigate through the pages in the report by either clicking on the pages listed below, or by using the keyword search tool below to find specific information within the annual report.-
 1
1 -
 2
2 -
 3
3 -
 4
4 -
 5
5 -
 6
6 -
 7
7 -
 8
8 -
 9
9 -
 10
10 -
 11
11 -
 12
12 -
 13
13 -
 14
14 -
 15
15 -
 16
16 -
 17
17 -
 18
18 -
 19
19 -
 20
20 -
 21
21 -
22
-
23
-
24
-
25
-
26
-
27
-
28
-
29
-
30
-
31
-
32
-
33
-
34
-
35
-
36
-
37
-
38
-
39
-
40
-
41
-
42
-
43
-
44
-
45
-
46
-
47
-
48
-
49
-
50
-
51
-
52
-
53
-
54
-
55
-
56
-
57
-
58
-
59
-
60
-
61
-
62
-
63
-
64
-
65
-
66
-
67
-
68
-
69
-
70
-
71
-
72
-
73
-
74
-
75
-
76
-
77
-
78
-
79
-
80
-
81
-
82
-
83
-
84
-
85
-
86
-
87
-
88
-
89
-
90
-
91
-
92
-
93
-
94
-
95
-
96
-
97
-
98
-
99
-
100
-
101
-
102
-
103
-
104
-
105
-
106
-
107
-
108
-
109
-
110
-
111
-
112
-
113
-
114
-
115
-
116
-
117
-
118
-
119
-
120
-
121
-
122
-
123
-
124
-
125
-
126
-
127
-
128
-
129
-
130
-
131
-
132
-
133
-
134
-
135
-
136
-
137
-
138
-
139
-
140
-
141
-
142
-
143
-
144
-
145
-
146
-
147
-
148
-
149
-
150
-
151
-
152
-
153
-
154
-
155
-
156
 |
 |

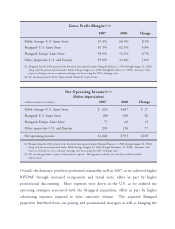
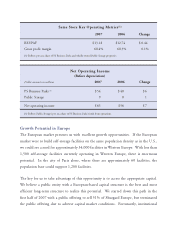
Same Store Key Operating Metrics(1)
2007 2006 Change
REVPAF $13.18 $12.74 $ 0.44
Gross profit margin 68.4% 68.3% 0.1%
(1) Reflects pro rata share of PS Business Parks and wholly-owned Public Storage properties.
Net Operating Income
(Before depreciation)
Dollar amounts in millions 2007 2006 Change
PS Business Parks (1) $54 $ 48 $6
Public Storage 9 8 1
Net operating income $63 $56 $7
(1) Reflects Public Storage’s pro rata share of PS Business Parks’ funds from operations.
Growth Potential in Europe
The European market presents us with excellent growth opportunities. If the European
market were to build self-storage facilities on the same population density as in the U.S.,
we could see a need for approximately 34,000 facilities in Western Europe. With less than
1,500 self-storage facilities currently operating in Western Europe, there is enormous
potential. In the city of Paris alone, where there are approximately 60 facilities, the
population base could support 1,200 facilities.
The key for us to take advantage of this opportunity is to access the appropriate capital.
We believe a public entity with a European-based capital structure is the best and most
efficient long-term structure to realize this potential. We started down this path in the
first half of 2007 with a public offering to sell 51% of Shurgard Europe, but terminated
the public offering due to adverse capital market conditions. Fortunately, institutional