Public Storage 2007 Annual Report Download - page 13
Download and view the complete annual report
Please find page 13 of the 2007 Public Storage annual report below. You can navigate through the pages in the report by either clicking on the pages listed below, or by using the keyword search tool below to find specific information within the annual report.-
 1
1 -
2
-
 3
3 -
 4
4 -
 5
5 -
 6
6 -
 7
7 -
 8
8 -
 9
9 -
 10
10 -
 11
11 -
 12
12 -
 13
13 -
 14
14 -
 15
15 -
 16
16 -
 17
17 -
 18
18 -
 19
19 -
 20
20 -
 21
21 -
 22
22 -
 23
23 -
24
-
25
-
26
-
27
-
28
-
29
-
30
-
31
-
32
-
33
-
34
-
35
-
36
-
37
-
38
-
39
-
40
-
41
-
42
-
43
-
44
-
45
-
46
-
47
-
48
-
49
-
50
-
51
-
52
-
53
-
54
-
55
-
56
-
57
-
58
-
59
-
60
-
61
-
62
-
63
-
64
-
65
-
66
-
67
-
68
-
69
-
70
-
71
-
72
-
73
-
74
-
75
-
76
-
77
-
78
-
79
-
80
-
81
-
82
-
83
-
84
-
85
-
86
-
87
-
88
-
89
-
90
-
91
-
92
-
93
-
94
-
95
-
96
-
97
-
98
-
99
-
100
-
101
-
102
-
103
-
104
-
105
-
106
-
107
-
108
-
109
-
110
-
111
-
112
-
113
-
114
-
115
-
116
-
117
-
118
-
119
-
120
-
121
-
122
-
123
-
124
-
125
-
126
-
127
-
128
-
129
-
130
-
131
-
132
-
133
-
134
-
135
-
136
-
137
-
138
-
139
-
140
-
141
-
142
-
143
-
144
-
145
-
146
-
147
-
148
-
149
-
150
-
151
-
152
-
153
-
154
-
155
-
156
 |
 |

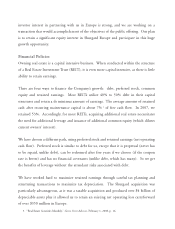
12/31/02 12/31/03 12/31/04 12/31/05 12/31/06 12/31/07
Public Storage $100.00 $141.12 $187.96 $235.21 $346.72 $267.66
S&P 500 Index $100.00 $128.68 $142.69 $149.70 $173.34 $182.86
NAREIT Equity Index $100.00 $137.13 $180.44 $202.38 $273.34 $230.45
S&P 500 Index
Public Storage
NAREIT Equity Index
Public Storage, S&P 500 Index and NAREIT Equity Index
December 31, 2002 - December 31, 2007
$400
$350
$300
$250
$200
$150
$100
$50
$0
12/31/02 12/31/03 12/31/04 12/31/05 12/31/06 12/31/07
The graph set forth above compares the yearly change in the Company’s cumulative total shareholder return on its Common Stock
for the five-year period ended December 31, 2007 to the cumulative total return of the Standard & Poor’s 500 Stock Index (“S&P
500 Index”) and the National Association of Real Estate Investment Trusts Equity Index (“NAREIT Equity Index”) for the same
period (total shareholder return equals price appreciation plus dividends). The stock price performance graph assumes that the value
of the investment in the Company’s Common Stock and each index was $100 on December 31, 2002 and that all dividends were
reinvested. The stock price performance shown in the graph is not necessarily indicative of future price performance.
CUMULATIVE TOTAL RETURN